The oil and gas market is expected to trade with high volatility in the near future. Oil remains under pressure, and its ability to stay above $70 will depend on further geopolitical developments and macroeconomic data.
Market snapshot
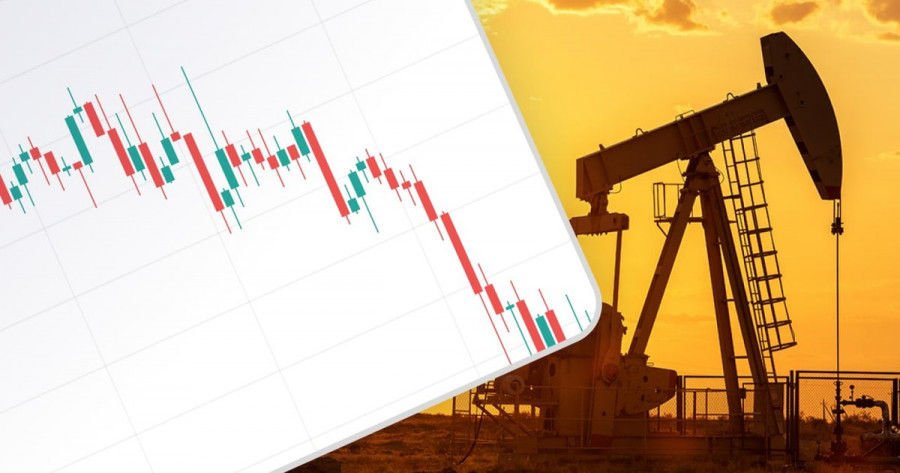
Brent crude oil futures have lost all their early-year momentum and are once again stuck in the consolidation range of $70 to $75, which has persisted since last fall.
As of the time of this report, the nearest futures contract was trading at $73.3 per barrel and is set to expire on Friday. The next futures contract is priced slightly lower at $72.7.
From a technical standpoint, the 4-hour chart shows oversold conditions, which could signal a potential short-term rebound. However, in the long term, oil remains weak, hovering near last year's lows.
Key bearish factors for oil market
The main driver behind oil's decline remains the anticipated supply surplus. Sanctions imposed against Russia appear unlikely to reduce global supply.
Additionally, speculation about a possible resolution to the Russia-Ukraine conflict has raised concerns over unrestricted Russian oil exports to global markets.
Further negative pressure comes from the US-China trade war, initiated by the Trump administration. The tariff restrictions have already begun to impact the economy by eroding consumer confidence and fueling inflation expectations. This, in turn, poses a risk of declining energy demand.
Why the market didn't respond to new sanctions on Iran
New restrictions on Iranian oil exports, which should have supported Brent prices, have had little notable impact on the market.
This could be due to past experiences—previous sanctions merely altered supply logistics rather than creating an actual shortage. However, the extent and severity of these new sanctions will ultimately determine their impact.
Some temporary support for oil prices came from the latest American Petroleum Institute (API) data, showing a decline in US crude oil inventories. This was the first drop in weeks, providing a brief relief from selling pressure.
Natural gas: a local upside
Natural gas futures have bounced off a short-term trendline, signaling a positive shift. However, on the 1-hour chart, the RSI indicator is showing overbought conditions, which could lead to a minor pullback before a potential new rally.
Key levels to watch
Resistance: $4.16, followed by $4.255.
Support: $3.958.

RÁPIDOS ENLACES


 Contáctenos