Wolfe Research uvedl, že investiční příběh společnosti Tesla (NASDAQ:TSLA) se stále více soustředí na její úsilí v oblasti AI a autonomie, i když krátkodobý výhled pro její hlavní automobilový byznys zůstává pod tlakem.
„Tato společnost se obchoduje spíše na základě narativu než čísel,“ napsali analytici. „Důvěra v příležitosti Tesly v oblasti AI zůstává nejdůležitějším hnacím motorem akcií.“
Makléřská společnost poukázala na několik nadcházejících katalyzátorů, včetně potenciálního schválení plně autonomního řízení v Číně a Evropě, hands-free řízení v některých částech USA a vývoje robotických taxi.
Wolfe také poznamenal, že humanoidní robot Optimus společnosti Tesla má být v roce 2026 uveden do sériové výroby, přičemž dlouhodobým cílem je dosáhnout do roku 2030 výroby 1 milionu kusů ročně.
Navzdory těmto ambicím společnost snížila odhady EPS pro roky 2025 a 2026 na 1,62 USD a 1,67 USD, což je výrazně pod konsensuálními očekáváními. Uvedla, že před námi stojí „náročné“ období, zejména pokud poptávka po modelech Model 3 a Model Y oslabí po vypršení daňových úlev na elektromobily v USA na konci roku 2025.
Divize Tesla Energy vynikla jako relativně silná. „Očekáváme, že tržby divize Energy se v roce 2026 zdvojnásobí oproti roku 2024 (na ~18 mld. USD oproti 9,2 mld. USD) a dosáhnou silné hrubé marže,“ uvedl Wolfe a zdůraznil výhodu společnosti v oblasti rozsahu a integrace, protože globální poptávka po bateriích pro skladování energie převyšuje nabídku.
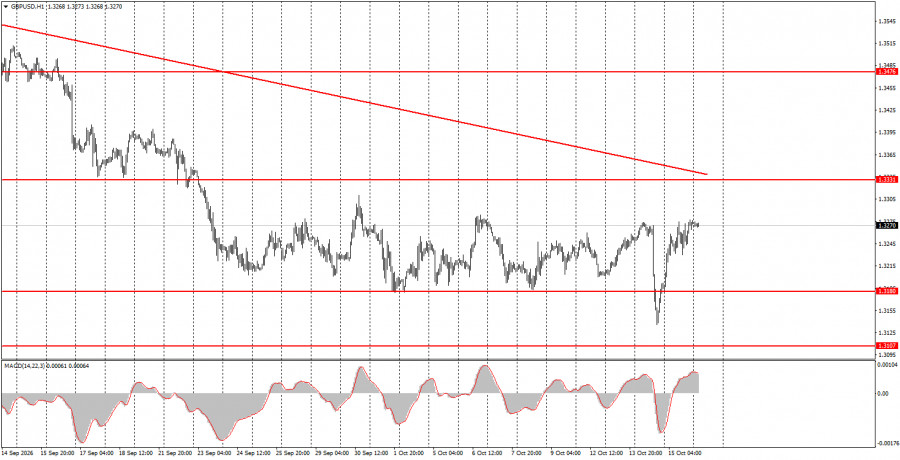
The GBP/USD pair showed no notable intraday moves on Thursday, aside from the overnight recovery after yesterday's US inflation report. Essentially, on Wednesday and Thursday the pair plunged sharply, then recovered sharply, returning to the sideways channel it had spent the previous three weeks in. So nothing has changed on the hourly chart technically. The dollar did not receive (rightly so) any extra market support despite higher inflation. UK GDP and industrial-production prints caused no reaction even though both were fairly solid. US PPI rose 1.3% in September—roughly two-and-a-half times market forecasts—yet it also did not provoke a trader response. This suggests the dollar may no longer rally on every event or for no reason at all. We believe the pound (like the euro) should have begun forming an uptrend some time ago.
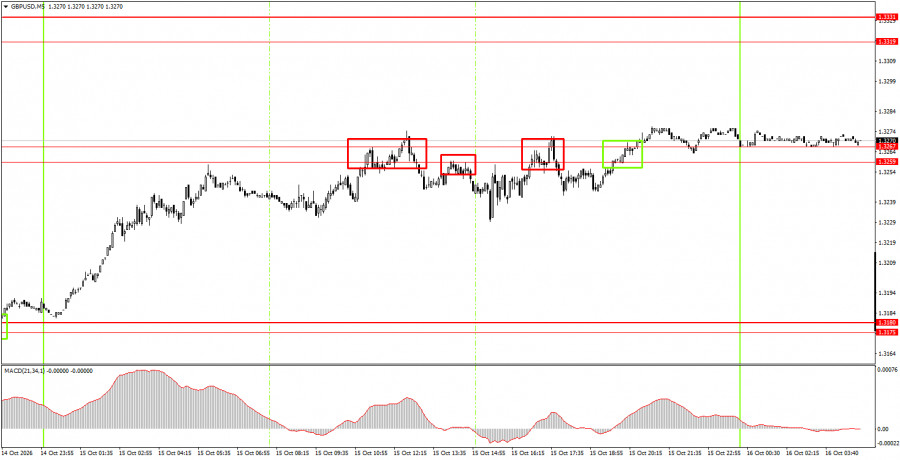
On the 5-minute timeframe, Thursday produced four trading signals in the 1.3259–1.3267 area. Price bounced off that zone three times, and the signals merely replicated each other; you could realistically take only one trade. The long position did not yield intraday profit but could have been carried into today, since the pound has been set on a recovery in recent days.
On the hourly timeframe, GBP/USD retains a downward tendency that has become a strong, full trend. The fundamental backdrop for the dollar improved after the Federal Reserve signaled readiness to begin tightening monetary policy. However, a month has passed, and the market continues to buy the dollar on any pretext. Therefore, we doubt Fed policy alone is driving the dollar's strength. We view the current move as illogical, inertia-driven and speculative.
On Friday, novice traders may consider short positions targeting 1.3175–1.3180 if price closes below the 1.3259–1.3267 area. Long positions can be held with a target of 1.3319–1.3331 following yesterday's buy signal in the 1.3259–1.3267 zone.
On the 5-minute timeframe trade the levels 1.3043, 1.3096–1.3107, 1.3175–1.3180, 1.3259–1.3267, 1.3319–1.3331, 1.3380–1.3386, 1.3456–1.3476, 1.3587–1.3598, 1.3631–1.3641. No major UK releases are expected on Friday; in the US, Kevin Warsh will speak, and US industrial-production data will be published, though the latter is of limited market interest at present.
Price levels (areas) of support and resistance serve as targets for opening buy or sell trades or as sources of signals.
Red lines indicate channels or trend lines that show the current trend and the preferred trading direction.
The MACD indicator (14,22,3) — the histogram and signal line — is an auxiliary indicator that can also provide signals.
Important speeches and reports (listed in the news calendar) can significantly influence currency pair movements. Therefore, during their release, traders should approach trading with utmost caution, or exit the market to avoid sudden reversals against the preceding move.
Beginner forex traders should remember that not every trade can be profitable. Developing a clear strategy and practicing money management are key to long-term success in trading.

SZYBKIE LINKI




















 Skontaktuj się z ForexMart