Trend Analysis:
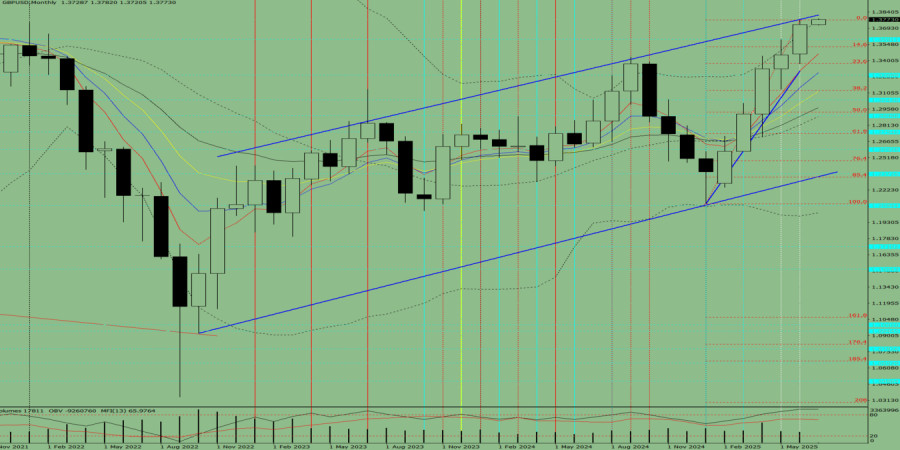
In July, the price may continue to rise from the 1.3769 level (closing price of the June monthly candle) toward the target at 1.3816 — the resistance line (thick blue line). Upon testing this line, the price may retrace downward to the 14.6% retracement level at 1.3523 (red dashed line).
Fig. 1 (Monthly Chart).
Indicator Analysis:
Conclusion from the comprehensive analysis: a downward trend is possible.
Overall forecast for the GBP/USD monthly candle: the price is likely to show a downward trend, with an upper shadow on the monthly black candle (first week of the month – white) and a lower shadow (last week of the monthly candle – white).
Alternative Scenario:From the 1.3769 level (closing price of the June monthly candle), the price may continue to rise toward the 1.3816 resistance line (thick blue line). Upon testing this line, the price may retrace downward toward the 1.3591 level — a historical resistance level (light blue dashed line).

SZYBKIE LINKI


 Skontaktuj się z ForexMart

