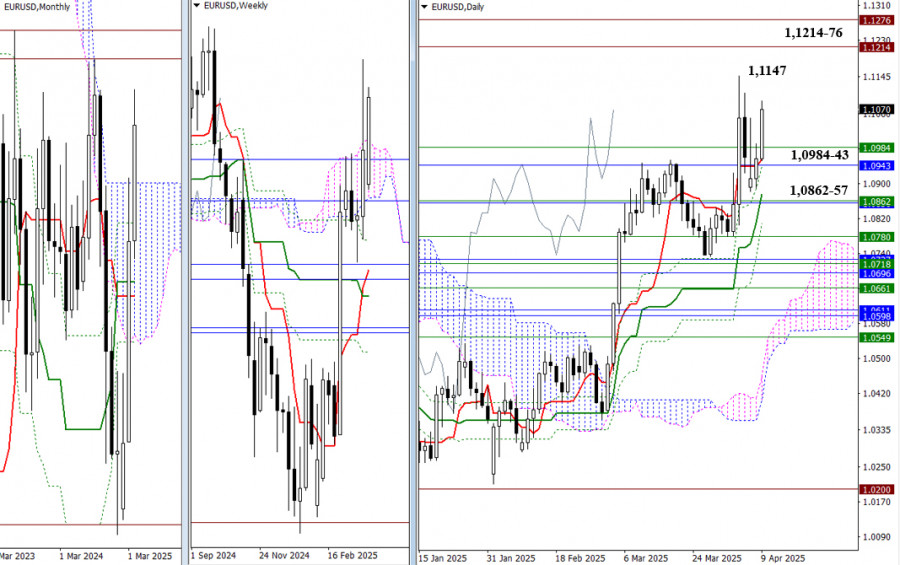
The bulls are attempting to regain control, and we are currently observing increased activity and a push toward the peak of the ongoing correction at 1.1147. A breakout above this level would shift the market's focus to historical resistance at 1.1214 and 1.1276. However, if buyers fail to achieve a breakout, the pair may again fall into the gravitational pull of support levels from various timeframes located lower at 1.0984 – 1.0943 – 1.0862-57.
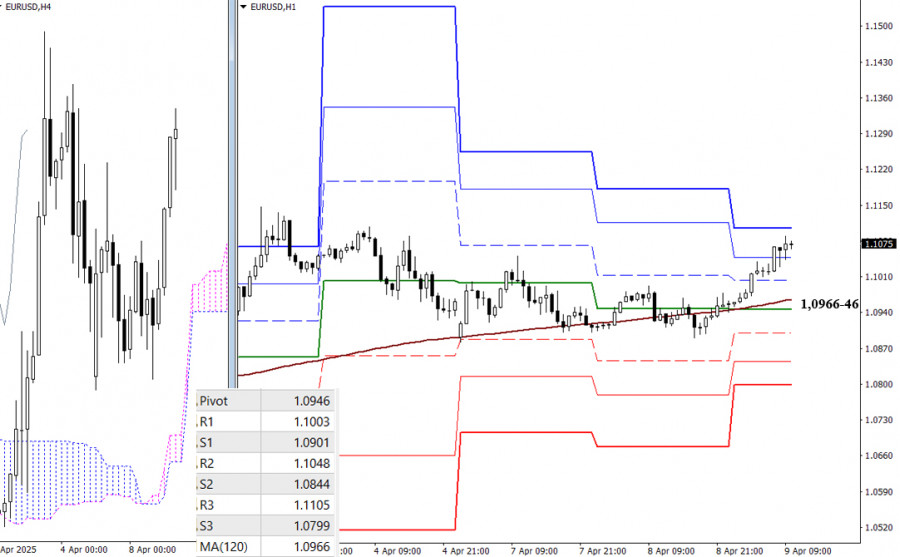
The weekly long-term trend has kept the market in bullish territory, enabling the bulls to initiate another upward move. Among key targets, the final resistance of the classic Pivot levels at 1.1105 remains untested, followed by higher timeframe boundaries. In the event of a downward correction, key support levels to watch are 1.0964-46 (central Pivot level + weekly long-term trend). If bearish pressure intensifies, further support will be found at 1.0901 – 1.0844 – 1.0799 (classic Pivot levels).
***
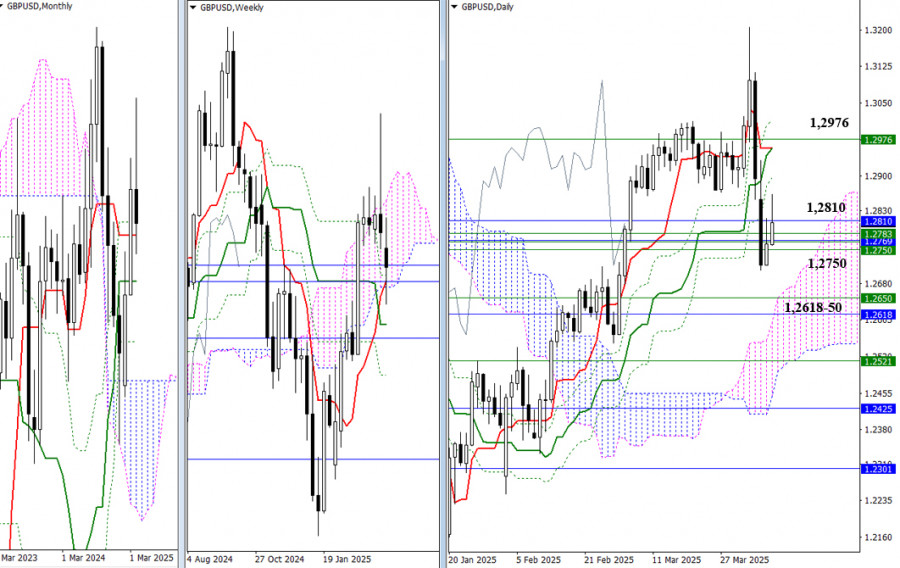
Recently, the British pound has been trying to halt its decline. Bulls are supported by a broad support zone between 1.2750 – 1.2810, which combines levels from different timeframes. If buyers consolidate above this zone, the market's attention will shift to the Ichimoku daily cross resistances at 1.1298 – 1.2956 – 1.3015, further reinforced by the weekly level at 1.2976. Failure to break higher could give sellers a good opportunity to regain control. The next downward target is located near the monthly medium-term trends at 1.2618 and the weekly trend at 1.2650, as well as the upper boundary of the daily cloud.
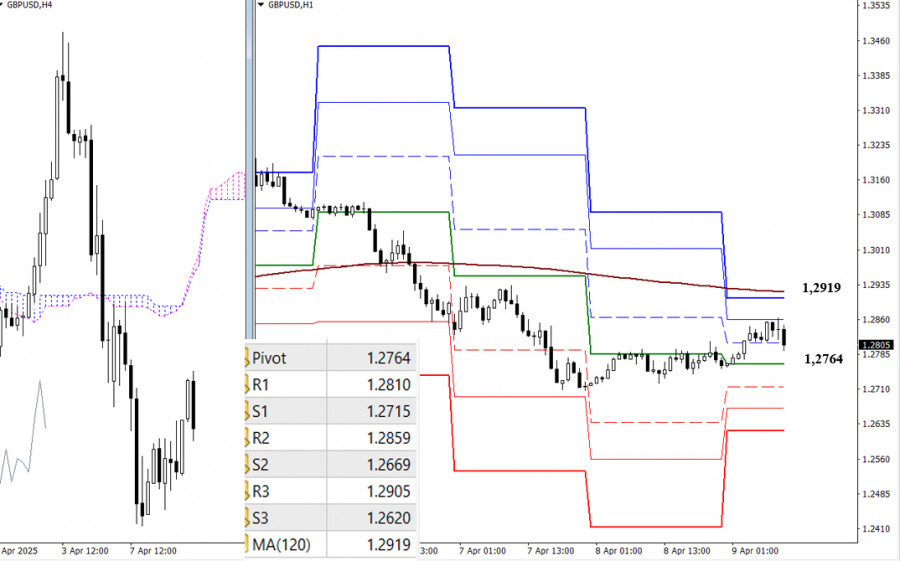
The bears still hold the advantage on lower timeframes, although a corrective upward move is underway. Its main target is the weekly long-term trend resistance at 1.2919. A breakout above and reversal of this trend would shift the balance in favor of the bulls. If the bears stop the correction and resume the decline, the next support levels will be the classic Pivot levels at 1.2764 – 1.2715 – 1.2669 – 1.2620.
***

SZYBKIE LINKI


 Skontaktuj się z ForexMart

