The GBP/USD currency pair traded lower on Wednesday. We had warned that the pair has recently been swinging like a pendulum. The pound was rising on Tuesday, so it could quickly and irrationally fall on Wednesday. But in this case, there was a reason. In the morning, the UK released its inflation report, which showed lower figures than forecast. These lower values increase the likelihood of a more dovish stance from the Bank of England. However, the deviation from forecasts was minor.
Thus, the pound had a formal reason to fall, and given recent price behavior, the drop was quite logical. Still, this decline doesn't open up any new opportunities for the dollar either. The greenback continues to show virtually no strength, even though it had two reasons to rise yesterday: the British inflation report and strong U.S. durable goods orders data.
From a technical perspective, a downtrend has begun to form on the hourly chart. But in reality, the decline is barely noticeable. A sluggish downward movement will likely continue until next week, when stronger macroeconomic drivers are expected, and new tariff announcements from Donald Trump could impact markets.
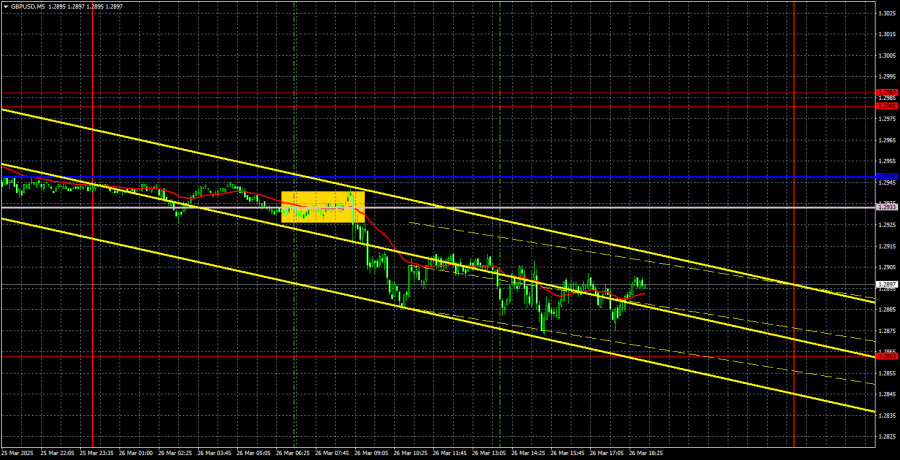
Surprisingly, a decent sell signal was generated in the 5-minute timeframe. During the European session, the price broke below the Senkou Span B line and moved downward by about 25–35 pips. However, just a day earlier, the price had completely ignored both the Senkou Span B and Kijun-sen lines due to the choppy nature of the market. So, yesterday's sell signal was more of a fluke.
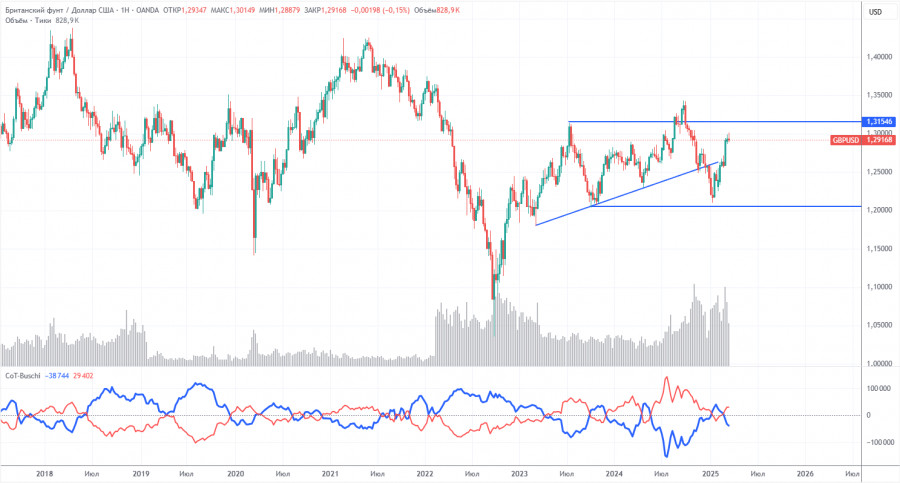
COT reports on the British pound show that commercial traders' sentiment has constantly changed in recent years. The red and blue lines, representing the net positions of commercial and non-commercial traders, intersect frequently and are mainly close to the zero level. They are also near each other, indicating that the number of long and short positions is roughly equal.
On the weekly chart, the price first broke the 1.3154 level and then dropped to the trendline, which it successfully breached. Breaking the trendline suggests that the pound is likely to continue falling. However, we should note a rebound from the second-to-last local low on the weekly chart. We may be dealing with a flat market.
According to the latest COT report on the British pound, the "Non-commercial" group opened 1,100 buy contracts and 900 sell contracts. As a result, the net position of non-commercial traders saw little change over the week.
The current fundamental backdrop does not support long-term buying of the pound, and the currency has a real possibility of continuing its global downward trend. The recent sharp increase in the pound's value can be attributed solely to Donald Trump's policies.
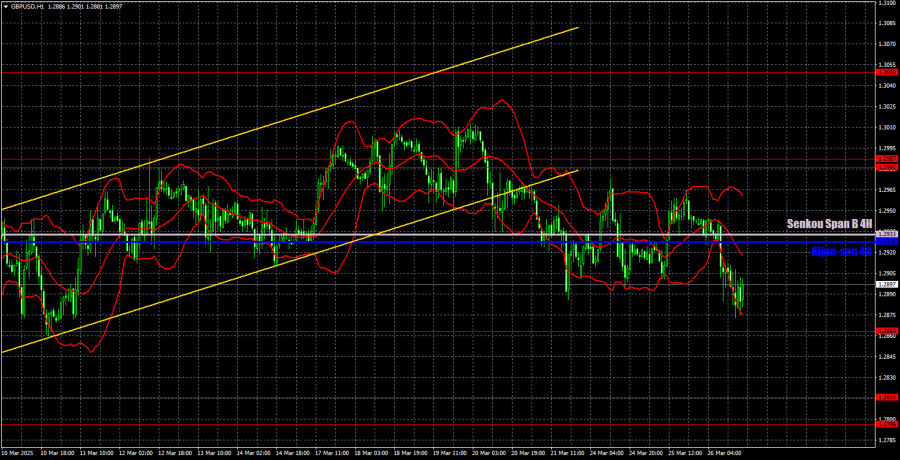
The GBP/USD pair has started a downtrend on the hourly chart, but the decline is still very weak. The upward correction on the daily timeframe has long been due to end. We still don't see any real reasons for the pound to rise long-term. The only factor currently supporting the pound is Donald Trump, who has endlessly imposed sanctions and tariffs. The market is ignoring all other factors. The pound can't even manage a proper correction after rising 650 pips.
Key trading levels for March 27: 1.2331–1.2349, 1.2429–1.2445, 1.2511, 1.2605–1.2620, 1.2691–1.2701, 1.2796–1.2816, 1.2863, 1.2981–1.2987, 1.3050, 1.3119. The Senkou Span B (1.2933) and Kijun-sen (1.2928) lines can also serve as trading signal references. Setting your Stop Loss to breakeven once the price moves 20 pips in the right direction is recommended. Remember, Ichimoku lines can shift during the day and should be monitored closely when identifying signals.
On Thursday, no significant events are scheduled in the UK, while the key event in the U.S. will be the third estimate of Q4 GDP. The U.S. economy is expected to slow to 2.3%, but a lower-than-expected reading would be a surprise and could trigger another dollar decline. A stronger figure, however, is unlikely to have much impact, as the market has shown little interest in positive U.S. data lately.

SZYBKIE LINKI


 Skontaktuj się z ForexMart

