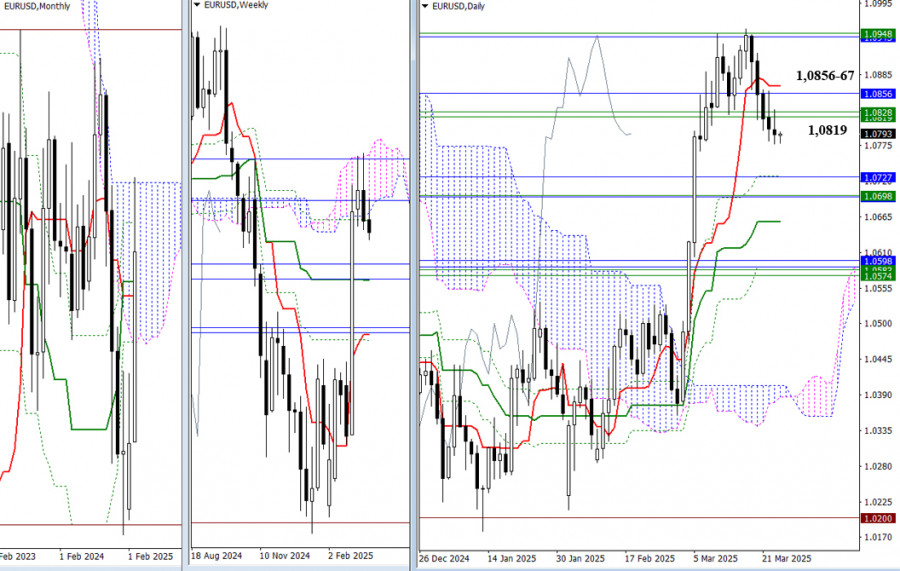
As the week begins, bearish players are trying to confirm and extend the prevailing downtrend, but they have yet to achieve strong results — The pair continues to stay close to the weekly levels. (1.0819 – 1.0828). If the decline does progress, the nearest target and next support zone for today lies at 1.0727 – 1.0698 (monthly Tenkan and Kijun lines + the weekly medium-term trend). If bears lack the strength to push lower and their opponents seize the initiative, the bulls' first step will be to reclaim the levels 1.0819 – 1.0856 – 1.0867 and consolidate above them.
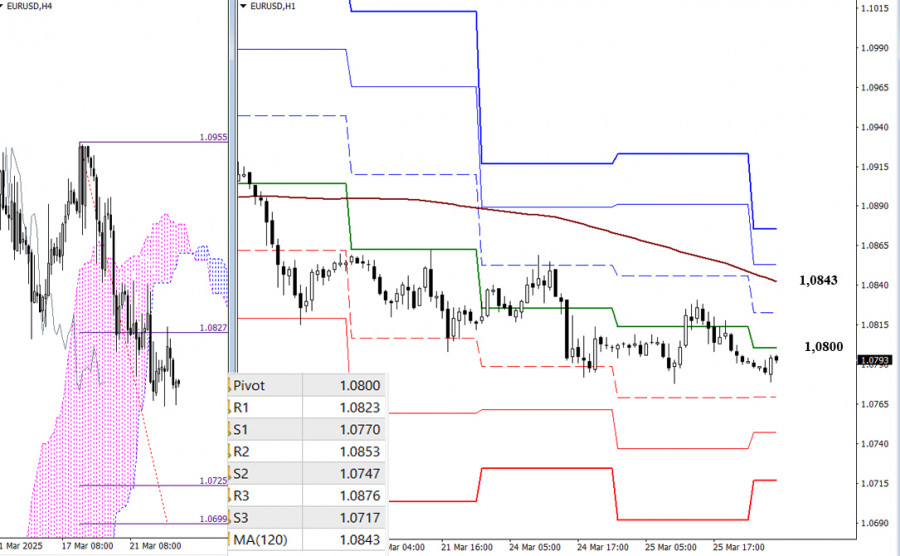
On the lower timeframes, bearish players are currently developing a downward trend. Their targets today include support from the classic Pivot levels (1.0770 – 1.0747 – 1.0717) and the breakout zone of the H4 Ichimoku cloud (1.0725 – 1.0699). If an upward correction develops, the market may encounter resistance near 1.0800 – 1.0823. However, the key level for the bulls will be testing and breaking through the weekly long-term trend line (1.0843). A breakout and reversal of the trend could shift the balance of power in favor of strengthening bullish sentiment. Additional intraday upside targets may include 1.0853 – 1.0876 (classic Pivot resistance levels).
***
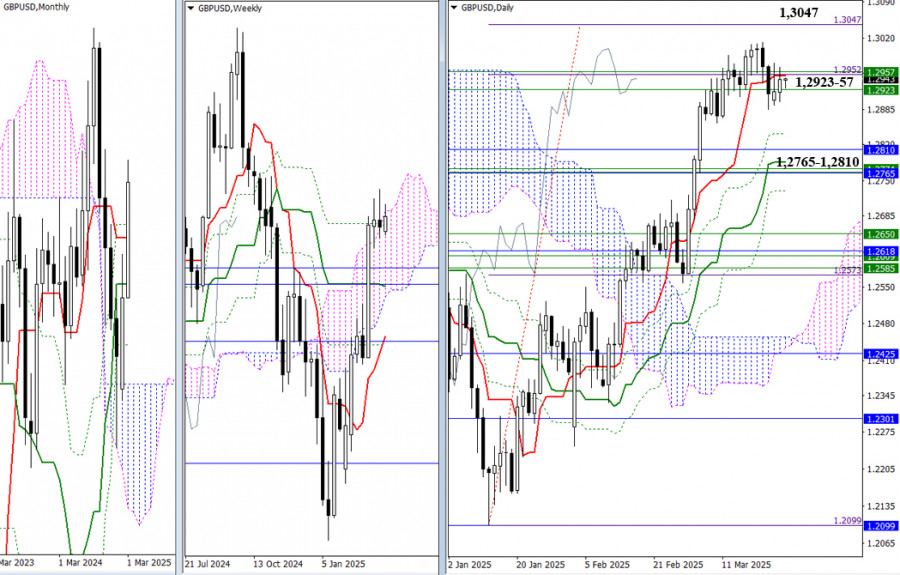
Uncertainty persists. The pound remains closely linked to its weekly levels (1.2923 – 1.2957) and the daily short-term trend line (1.2950). All other key levels have also remained in place. The nearest bullish target is the complete achievement of the daily cloud breakout goal at 100% (1.3047), while bearish targets are still clustered around support from multiple timeframes, led by the monthly support zone at 1.2765 – 1.2810.
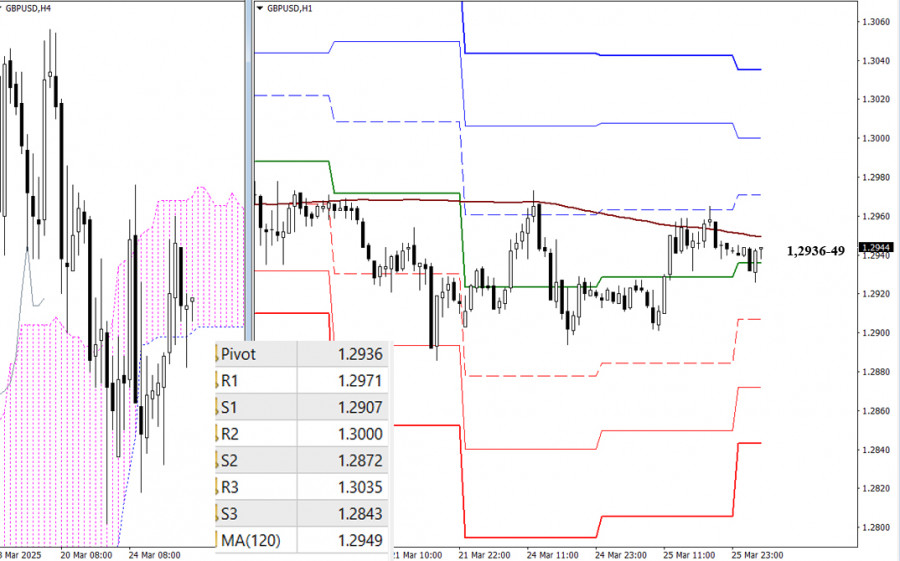
On the lower timeframes, the market is currently testing the key levels at 1.2936 (central Pivot level) and 1.2949 (weekly long-term trend). A breakout and consolidation above these levels would help bulls shift the balance of power and gain a stronger advantage. A rejection would create an opportunity for further declines. Today's bearish intraday trend targets include the classic Pivot supports at 1.2907 – 1.2872 – 1.2843.
***

SZYBKIE LINKI


 Skontaktuj się z ForexMart

