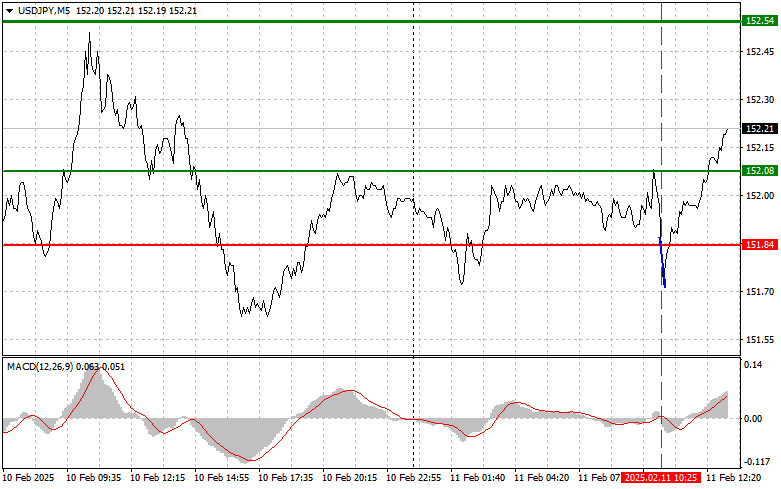
The test of 151.84 occurred when the MACD indicator was just starting to move downward from the zero level, confirming a valid short entry. However, a major drop did not follow, and after a 15-point decline, the market reversed direction.
USD/JPY's next move will depend on U.S. economic data and Fed statements. The NFIB Small Business Optimism Index is a key indicator of economic confidence. A strong NFIB reading suggests expansion, hiring, and investment, boosting demand for the U.S. dollar. Traders view positive NFIB data as a sign of U.S. economic health, often leading to USD appreciation. Additionally, strong NFIB numbers may influence the Fed's monetary policy stance.
Michelle Bowman may provide insights into the Fed's inflation-fighting strategy and potential rate-cut decisions. John Williams, as the New York Fed President, carries significant influence on monetary policy. His comments on financial conditions and economic outlook will be closely analyzed.
If the Fed adopts a hawkish tone, selling pressure may increase on USD/JPY.
For intraday strategy, I will focus primarily on Scenario #1 and Scenario #2, continuing the downward trend.
Buy Signal
Scenario #1: Buying USD/JPY is possible at 152.26 (green line on the chart) with an upward target of 152.62 (thicker green line on the chart). At 152.62, I will exit the trade and consider selling USD/JPY in the opposite direction, expecting a 30-35 point retracement. Buying the pair is best suited within the broader sideways range.
Important! Before buying, ensure that the MACD indicator is above the zero level and just starting to rise.
Scenario #2: Another buy opportunity arises if the price tests 152.08 twice while the MACD indicator is in the oversold zone. This scenario limits downward potential and triggers a bullish reversal. Target levels: 152.26 and 152.62.
Sell Signal
Scenario #1: Selling USD/JPY is planned after breaking below 152.08 (red line on the chart) with a downward target of 151.75. At 151.75, I will exit the trade and enter a buy position, aiming for a 20-25 point retracement. A corrective pullback may put short-term pressure on the pair.
Important! Before selling, ensure that the MACD indicator is below the zero level and just starting to decline.
Scenario #2: Another sell opportunity is possible if the price tests 152.26 twice while the MACD indicator is in the overbought zone. This scenario limits upward potential and triggers a bearish reversal. Target levels: 152.08 and 151.75.
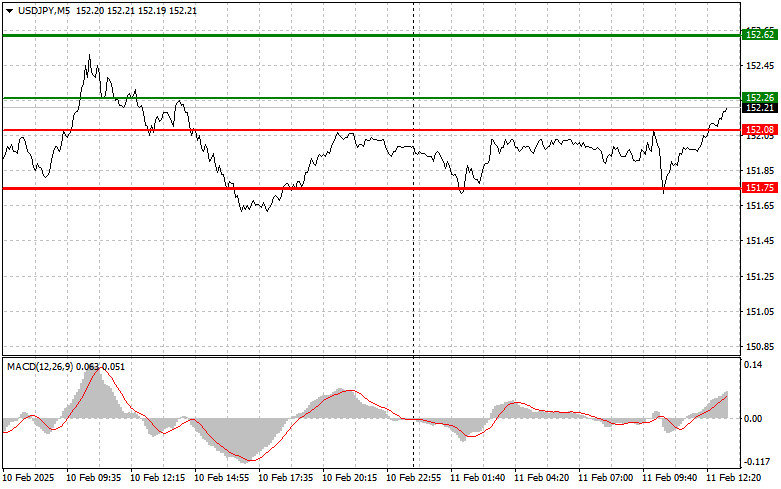
Chart Breakdown
Important Notes for Beginner Forex Traders

SZYBKIE LINKI


 Skontaktuj się z ForexMart

