
EUR/USD
Higher Timeframes:
After testing the support at the first weekly Ichimoku breakout target (1.0497), the pair slowed down and entered a consolidation phase. Key downside targets such as the weekly goal (1.0497 – 1.0410) and the monthly mid-term trend support (1.0454) remain intact. If the pair exits the consolidation zone to the upside, market interest will likely shift to the resistance zone at 1.0649 – 1.0729 – 1.0771, where levels from different timeframes converge.

H4 – H1:
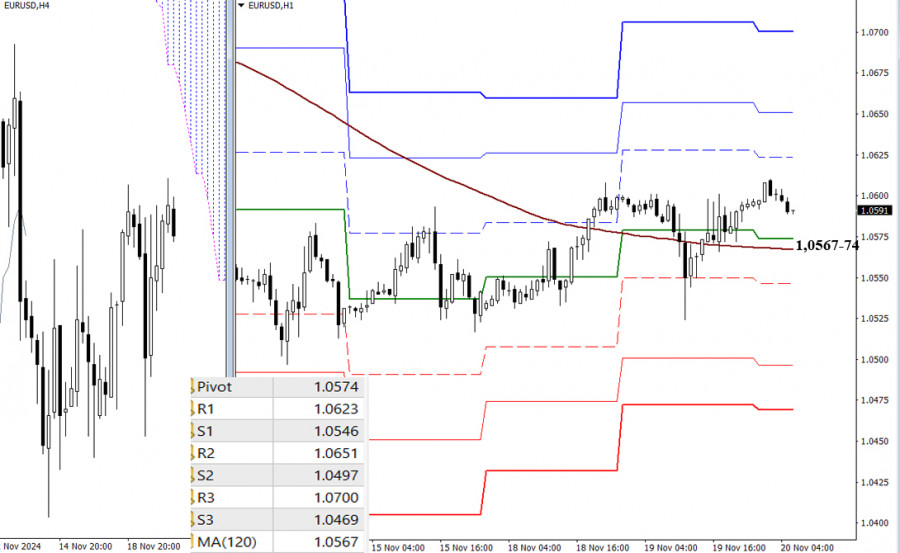
On the lower timeframes, the pair has consolidated above the key levels at 1.0567-74 (weekly long-term trend + central daily Pivot level), giving the bulls the upper hand. Intraday bullish targets include classic Pivot resistance levels (1.0623 – 1.0651 – 1.0700).
However, if the market loses these key supports (1.0567 – 1.0574), bears will regain control and aim for classic Pivot supports (1.0546 – 1.0497 – 1.0469).
***

Higher Timeframes:
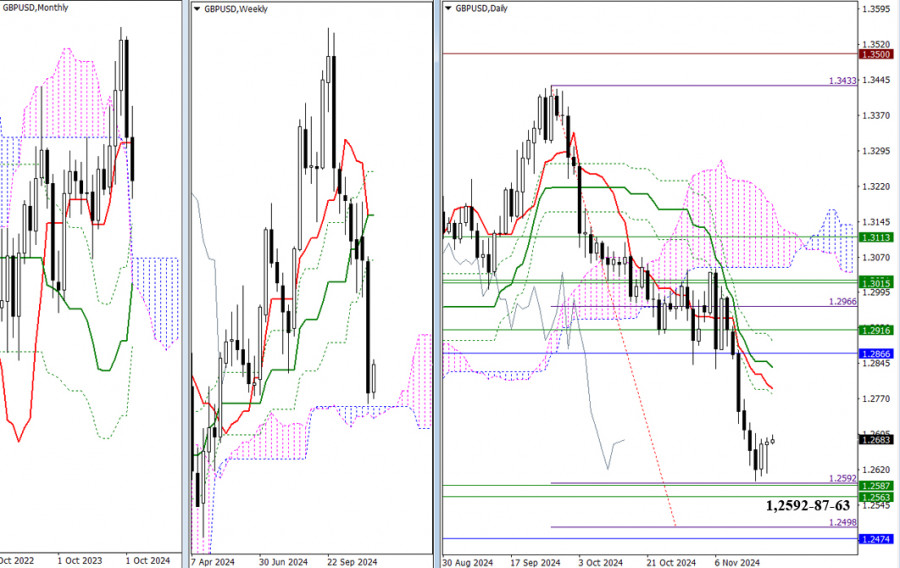
Recently, the pound neared a strong support zone, which includes the daily Ichimoku breakout target (1.2592 – 1.2498), the weekly Ichimoku cloud (1.2563 – 1.2587), and the monthly support (1.2474). These levels have slowed the downtrend, giving the bears a pause. If this slowdown becomes a correction, the market will first encounter daily Ichimoku cross resistances (1.2792 – 1.2836) and the monthly short-term trend (1.2866).

H4 – H1:
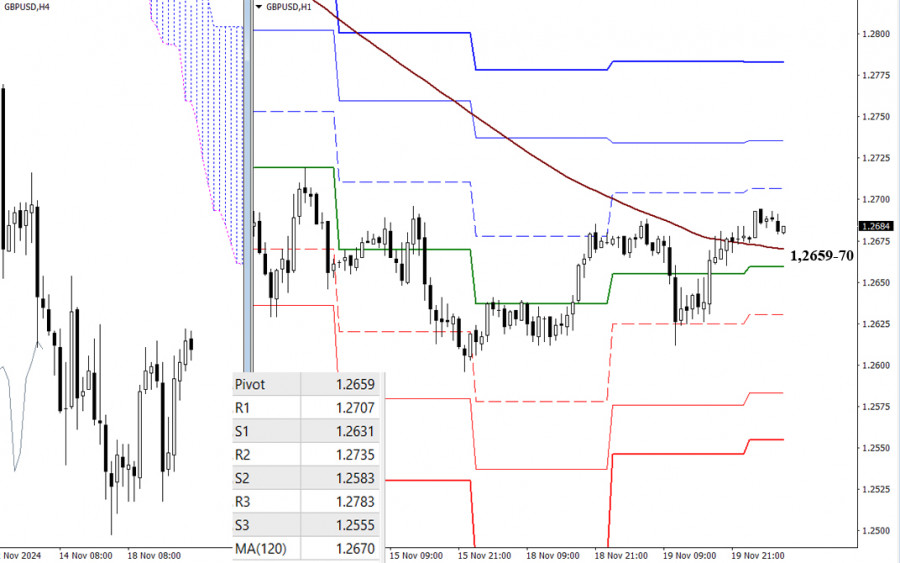
In the lower timeframes, the pair moved above the key levels at 1.2659-70 (central daily Pivot + weekly long-term trend), providing the bulls an advantage. Intraday bullish targets lie at classic Pivot resistance levels (1.2707 – 1.2735 – 1.2783).
If the trend reverses again and the pair moves below the key levels, bearish momentum may develop. Intraday downside targets include classic Pivot supports at 1.2631 – 1.2583 – 1.2555.

SZYBKIE LINKI