GOLD
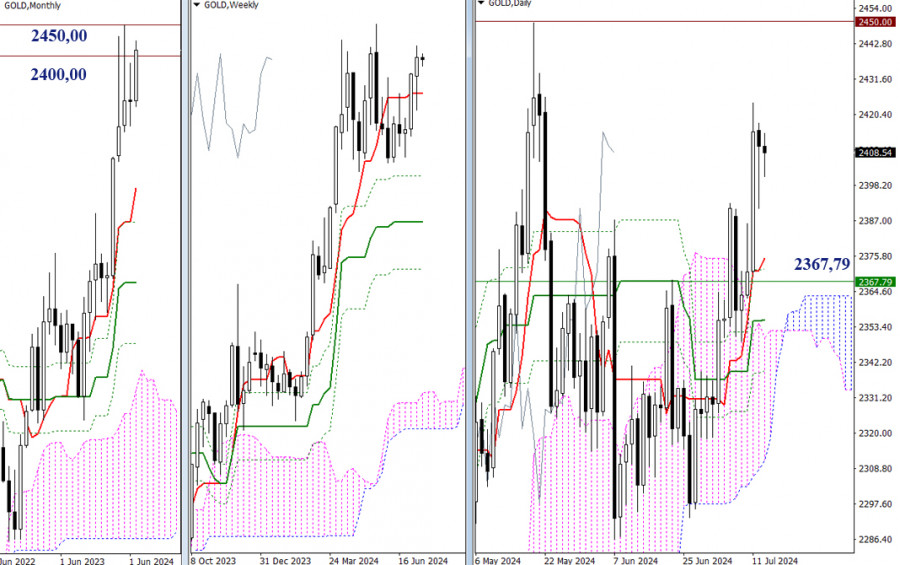
In April, gold reached and tested the psychological threshold of 2400.00. In May, the bulls made another attempt, and the trading instrument managed to rise to the area of 2450.00, but the result was similar to April's attempt. As a result, the two monthly candles have long upper shadows and this led to uncertainty in June. To change the situation and gain new prospects, the bulls must overcome the resistance at 2400.00 and 2450.00, firmly consolidating above these levels. The current influence, and containment of the situation in this part of the chart are currently also influenced by the weekly short-term trend (2367.79). Near the weekly trend and slightly below are the daily Ichimoku cross (2351.89 – 2444.24 – 2339.37 – 2326.84) and the daily Ichimoku cloud (2366.65 – 2303.11). It is necessary to break through the daily cross and cloud to further strengthen the bearish bias in the market.
H4 – H1
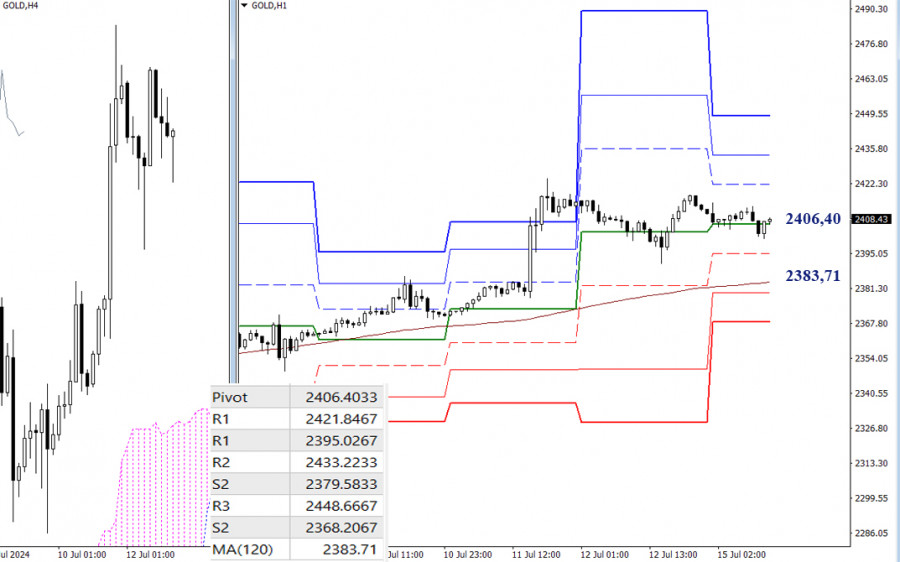
On the lower timeframes, gold has long been in the area of the central Pivot level of the day (2406.40), which contributes to uncertainty. If the bulls manage to break free from the influence of the central Pivot level, the market's intraday focus will be on working out the resistances of the classic Pivot levels (2421.85 – 2433.22 – 2448.67). If the bears start to become more active, their first task will be to test and break the weekly long-term trend (2383.71), and then the focus will be on the supports of the classic Pivot levels (2379.58 – 2368.21).
***
The technical analysis of the situation uses:
Higher timeframes - Ichimoku Kinko Hyo (9.26.52) + Fibonacci Kijun levels
Lower timeframes - H1 - Pivot Points (classic) + Moving Average 120 (weekly long-term trend)

SZYBKIE LINKI
ForexMart is authorized and regulated in various jurisdictions.
(Reg No.23071, IBC 2015) with a registered office at Shamrock Lodge, Murray Road, Kingstown, Saint Vincent and the Grenadines
Restricted Regions: the United States of America, North Korea, Sudan, Syria and some other regions.


 Skontaktuj się z ForexMart

