Analiza rynku

Przeglądy analityczne ForexMart dostarczają aktualnych informacji na temat rynku finansowego. Przeglądy te zawierają informacje o trendach rynkowych, prognozach finansowych, raportach ekonomicznych i wiadomościach politycznych, które mają wpływ na rynek.

Disclaimer:  ForexMart nie udziela rekomendacji inwestycyjnych, a dostarczone materiały analityczne nie gwarantują przyszłych wyników.

Dynamics of precious metals prices
07:05 2023-01-04 UTC--5
Analiza kursów walut

Precious metals have shown a very mixed performance in 2022. And if not for the last quarter of the year, the results would have been very different.

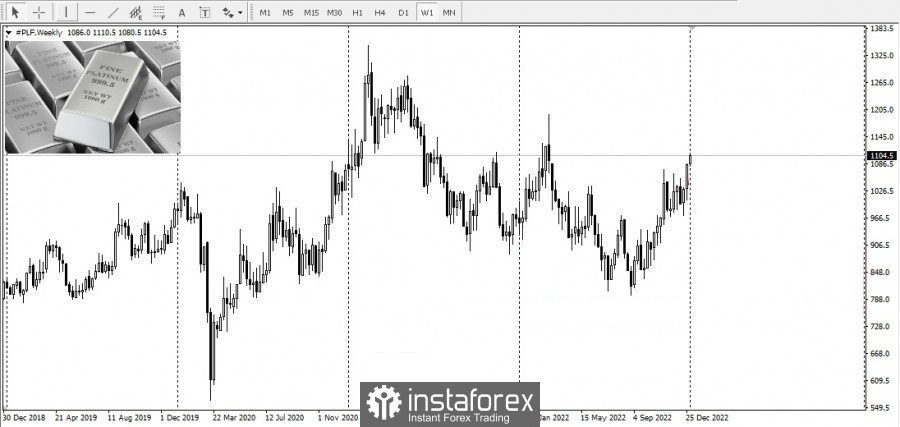
The price of platinum precious metals performed the best, up nearly 11% year-over-year:
analytics63b56dc869023.jpg

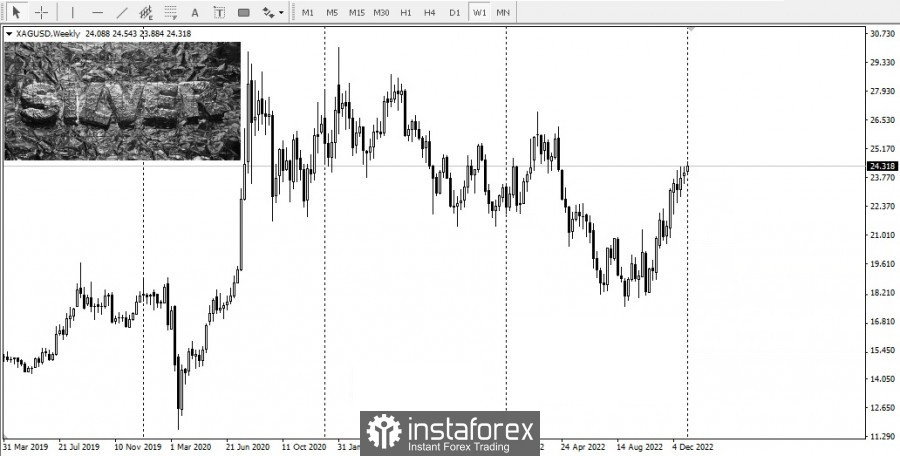
Silver was next in line, up almost 3% in 2022:
analytics63b56dcb5e342.jpg

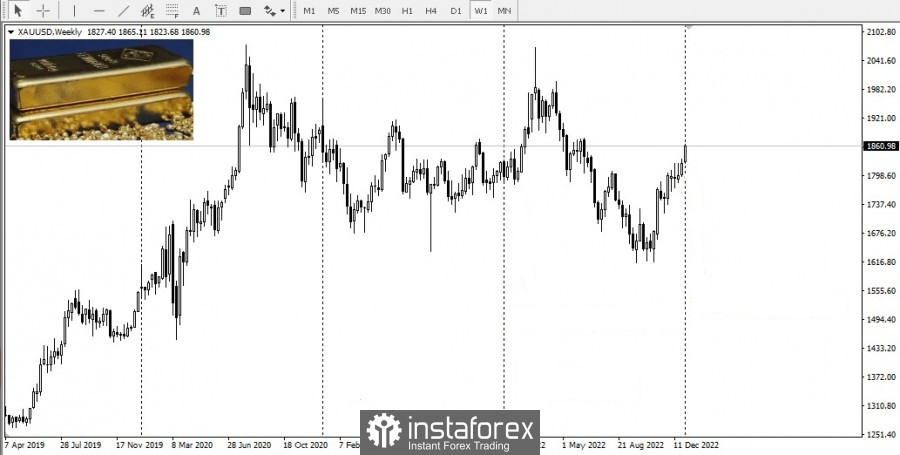
Gold ended the year flat:

analytics63b56dce375ae.jpg

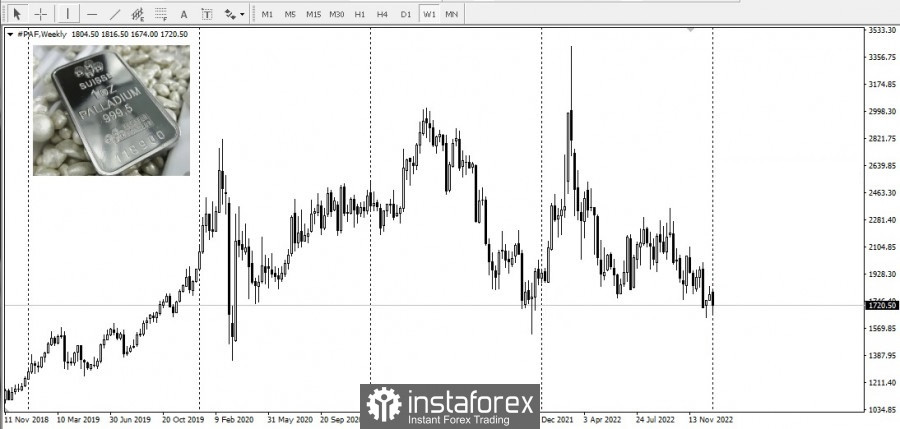
And palladium was the worst for investors, down about 6% for the year:
analytics63b56dd1201e8.jpg

Spot platinum started 2022 at about $965 an ounce and ended at about $1,068 an ounce. Spot silver opened last year at $23.28 an ounce, and ended the year at $23.93 an ounce. Spot gold at the beginning of 2022 was worth about $1,828 an ounce, and finished just above $1,822 an ounce. And spot palladium started at about $1,902 an ounce and ended in 2022 at about $1,790 an ounce.

Significant fluctuations were observed during the year: the difference between the yearly high and the yearly low was about $450 or 28% in the case of gold, $9.4 or more than 50% in the case of silver, and $360 or 44% in the case of platinum.

The price range for palladium was particularly wide at around $1,800, with the yearly high, which was also a record, more than double the yearly low.

The timing of each precious metal reaching its yearly lows also varied. Palladium suffered the biggest losses towards the end of the year, while gold, silver and platinum reached their yearly lows in September. Highs for all four precious metals were reached at about the same time—in early March. It was a reaction to geopolitical tensions

Opinie

ForexMart is authorized and regulated in various jurisdictions.

(Reg No.23071, IBC 2015) with a registered office at Shamrock Lodge, Murray Road, Kingstown, Saint Vincent and the Grenadines

Restricted Regions: the United States of America, North Korea, Sudan, Syria and some other regions.


© 2015-2024 Tradomart SV Ltd.
Top Top
defer(function(){ $("#cookies_modal").modal('show'); setCookie('fm_cookies', 'agree'); $(document).on('click', ".fm_cookies", function () { $("#cookies_modal").modal('hide'); setCookie('fm_cookies', 'agree'); }); }); function setCookie(key, value) { var expires = new Date(); expires.setTime(expires.getTime() + (10 * 365 * 1 * 24 * 60 * 60 * 1000)); document.cookie = key + '=' + value + ';expires=' + expires.toUTCString(); }
Ostrzeżenie o ryzyku:
Kontrakty CFD są złożonymi instrumentami i wiążą się z wysokim ryzykiem szybkiej utraty pieniędzy z powodu dźwigni finansowej. 71.71% kont inwestorów detalicznych traci pieniądze podczas handlu kontraktami CFD. Zastanów się, czy rozumiesz, jak działają kontrakty CFD i czy możesz sobie pozwolić na wysokie ryzyko utraty pieniędzy.