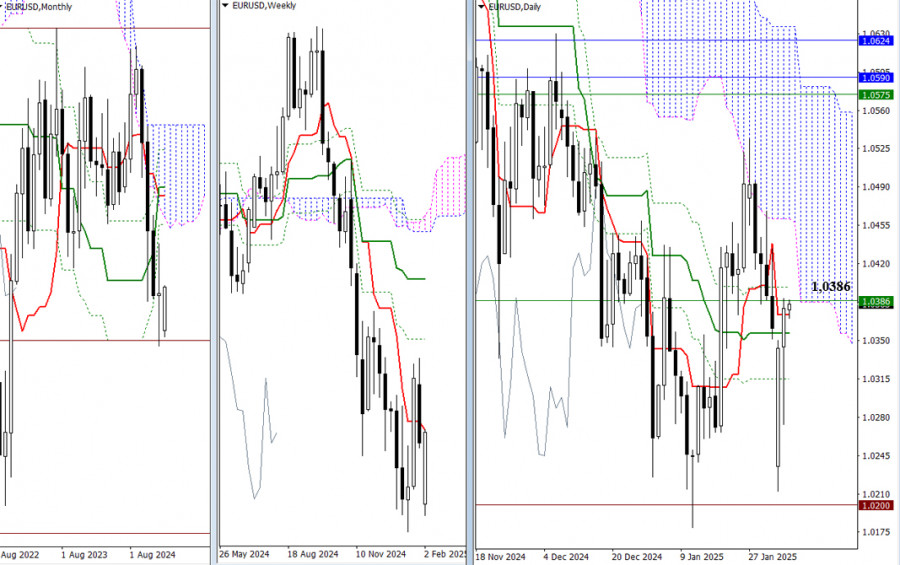
A downward gap has pushed the pair significantly lower. Bullish traders have made considerable efforts to close this gap and return to the range influenced by the weekly short-term trend at 1.0386 and the daily Ichimoku cross ranging from 1.0356 to 1.0373. Trading in this area, where multiple resistance levels converge, could form a consolidation. If the pair breaks above these currently tested levels, it may enter the daily cloud at 1.0461, with potential further movement towards the weekly resistance at 1.0575 and the monthly cloud at 1.0595. On the other hand, if there is a rebound from these levels, the pair could fall back toward historical support at 1.0200 and the minimum extreme at 1.0176, renewing efforts to restore the bearish trend.
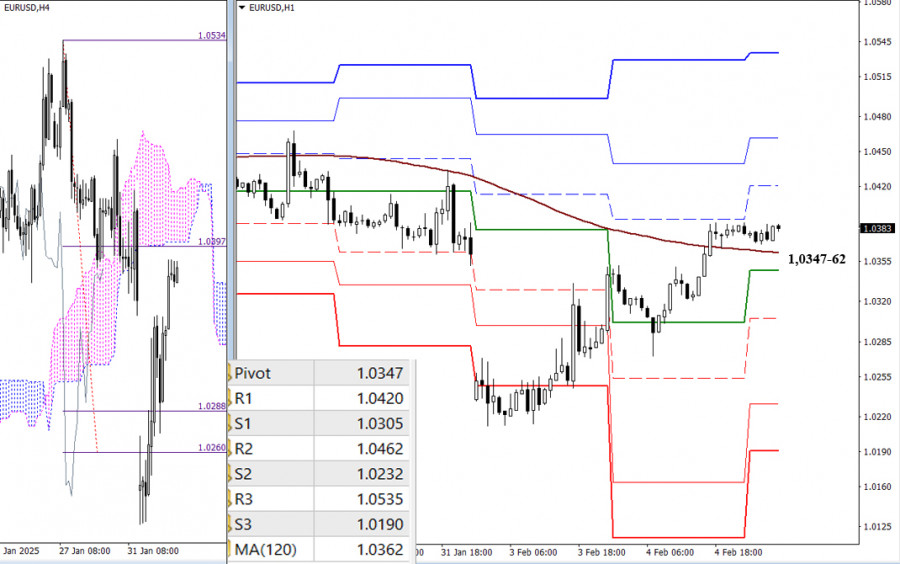
At the beginning of the trading week, a downward gap pushed the market below the H4 cloud breakout target on lower timeframes. However, bullish traders managed to recover, shifting the current balance of power in their favor. The main advantage for the bulls now lies in trading above the weekly long-term trend at 1.0362. If they can maintain this position, they will be able to continue their ascent, with targets set at 1.0420, 1.0462, and 1.0535, which are the resistance levels of classic Pivot points. If the trend fails to hold, a consolidation below these levels, and a bound, will return bearish sentiment to the market. The intraday downside targets are the support levels of the classic Pivot points at 1.0305, 1.0232, and 1.0190.
***
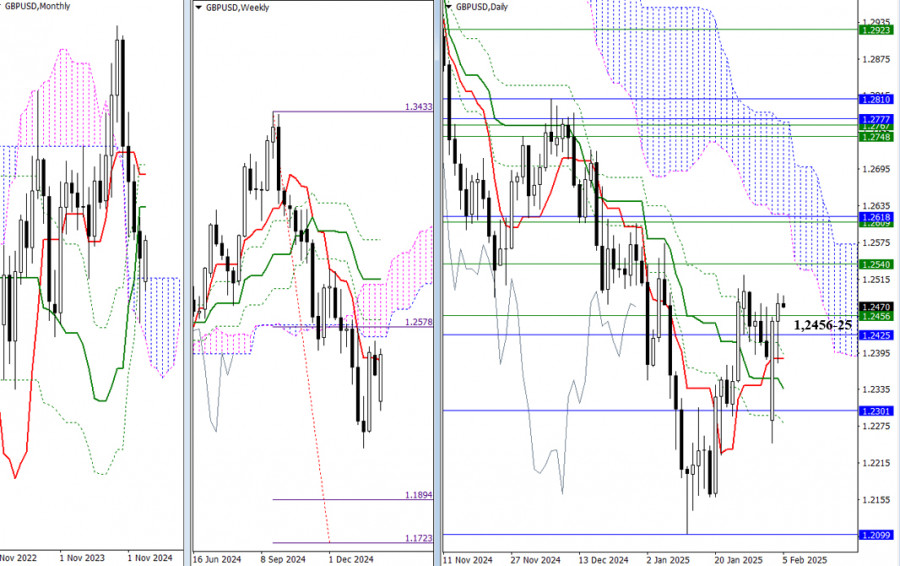
After a significant downward gap, bullish players quickly managed to recover their positions, closing the gap on the first day. Currently, having consolidated above the cluster of levels between 1.2425 and 1.2456, the bulls may continue their upward movement. The nearest bullish targets are at 1.2540 (the lower boundary of the weekly cloud) and 1.2609 to 1.2618 (representing the monthly mid-term trend and the weekly Fibonacci Kijun). If the bulls take a pause, we are likely to enter another period of uncertainty and consolidation. This is due to a significant cluster of support levels from higher timeframes just below the current price chart, which includes 1.2456, 1.2425, 1.2385, 1.2336, and 1.2301. The goal for bearish players remains unchanged—they aim to push the pair back into the monthly bearish cloud at 1.2301.
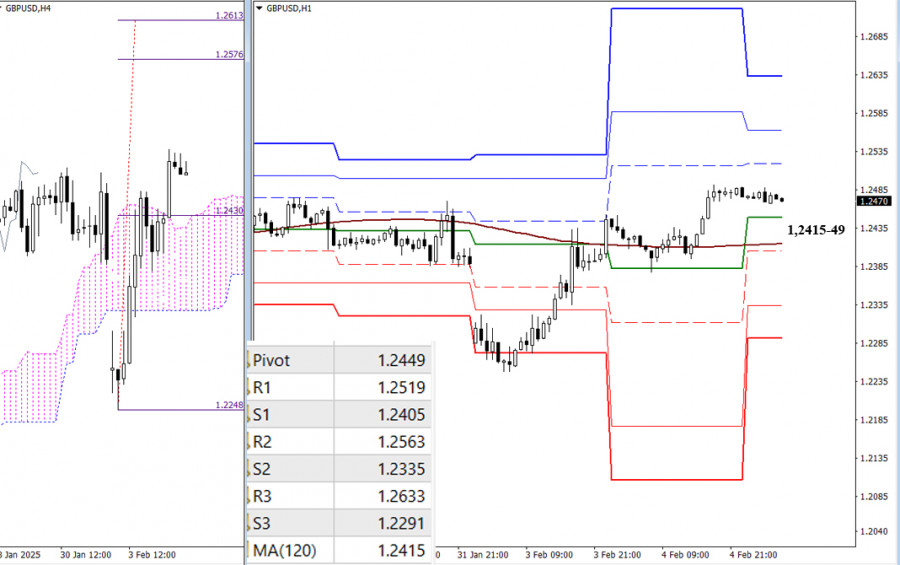
On the lower timeframes, bulls have gained an advantage by closing the gap, leading to an upward breakout target aligned with the H4 cloud. Currently, bullish players hold the primary advantage, with intraday targets identified at classic Pivot resistance levels of 1.2519, 1.2563, and 1.2633, as well as the H4 cloud breakout target ranging from 1.2576 to 1.2613. To alter the current balance of power, bearish players need to drive the price back below the key levels of 1.2415 to 1.2449, which include the daily central Pivot level and the weekly long-term trend, thus entering the bearish zone. In this scenario, downside targets would be the support levels indicated by classic Pivot points at 1.2405, 1.2335, and 1.2291.
***

فوری رابطے


 ہم سے رابطہ کریں

