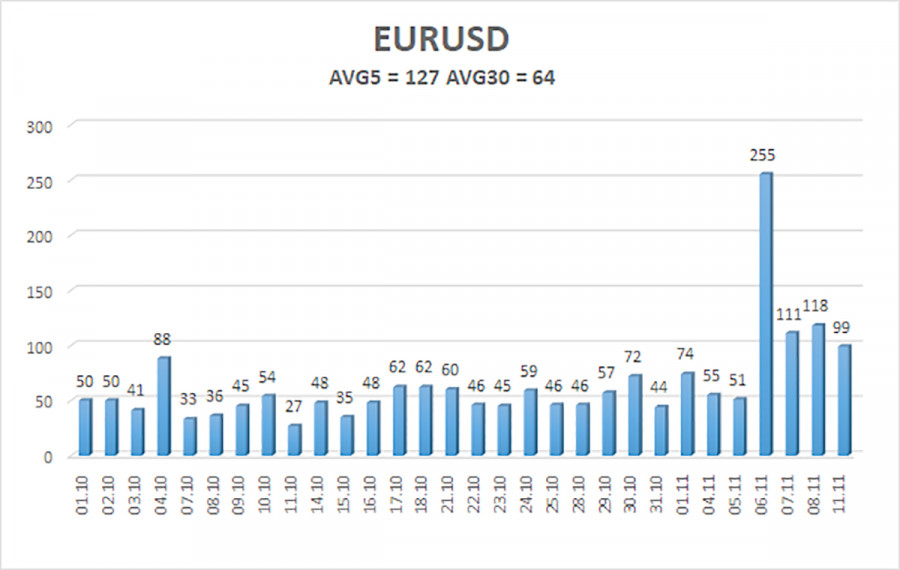

The EUR/USD pair continued its downward movement on Monday. Surprisingly, the market rushed to buy the dollar at the start of the week despite no significant events occurring in the U.S. or the EU. This highlights the overwhelming demand for the dollar that we underestimated. Looking back, the market spent two years selling off the U.S. dollar without apparent justification. Analysts spoke of a weakening U.S. economy, recession risks, Federal Reserve easing, and even the potential collapse of the economy. These claims attempted to rationalize the market behavior, but we argued throughout 2024 that the dollar's decline was illogical. Market makers artificially pushed EUR/USD higher without any substantial reasoning—plain market manipulation.
We warned that after September 18, a strong dollar rally could begin as the primary driver of its decline—Fed rate cuts—would have already been priced in. We also anticipated the resumption of a global downtrend simply because the long-term trend remained bearish. After September 18, EUR/USD lost approximately 500 pips and fell almost daily, even on a quiet Monday devoid of macroeconomic and fundamental factors.
It appears that the market doesn't need external justification for the dollar's rise right now. Some may argue that Donald Trump's election victory (which hasn't even happened yet) is fueling the dollar rally. While we partly agree that Trump's win could favor the dollar, this factor alone isn't sustainable. There's no certainty that Trump will trigger new trade wars or cause inflation to spike. Concerns about such risks are speculative—similar to the unfounded recession fears that never materialized.
We believe the dollar's primary driver remains the completed cycle of Fed easing, combined with the market's neglect of monetary easing in the EU and UK. Throughout the euro and pound rallies, the market ignored the weaknesses in the European and British economies, labeling meager growth of 0.2% as "recovery" or "a strong result in challenging times." Meanwhile, the U.S. economy grew 3-4% per quarter, yet analysts dismissed it and overestimated its decline. The dollar remains undervalued and oversold, paving the way for continued growth.

The average volatility of EUR/USD over the past five trading days is 127 pips, categorizing it as "high." On Tuesday, we expect the pair to move within the range of 1.0530–1.0784. The linear regression channel points downward, signaling a sustained global downtrend. The CCI indicator recently dipped into the oversold zone, signaling the start of a corrective phase that may already be over.
Nearest Support Levels:
S1: 1.0620
Nearest Resistance Levels:
R1: 1.0681
R2: 1.0742
R3: 1.0803
The EUR/USD pair continues its downward trajectory. For weeks, we've emphasized our bearish outlook for the euro in the medium term and reiterated our support for the downtrend. There's a possibility that the market has already priced in most of the future Fed rate cuts. If so, the dollar has even fewer reasons to weaken—there weren't many. Short Positions remain viable with targets at 1.0620 and 1.0530 as long as the price stays below the moving average. If you are trading on a "pure" technique, Long Positions can be considered only above the moving average with targets at 1.0901 and 1.0925. However, we currently do not recommend entering long positions.
Linear Regression Channels help determine the current trend. If both channels are aligned, it indicates a strong trend.
Moving Average Line (settings: 20,0, smoothed) defines the short-term trend and guides the trading direction.
Murray Levels act as target levels for movements and corrections.
Volatility Levels (red lines) represent the likely price range for the pair over the next 24 hours based on current volatility readings.
CCI Indicator: If it enters the oversold region (below -250) or overbought region (above +250), it signals an impending trend reversal in the opposite direction.

فوری رابطے