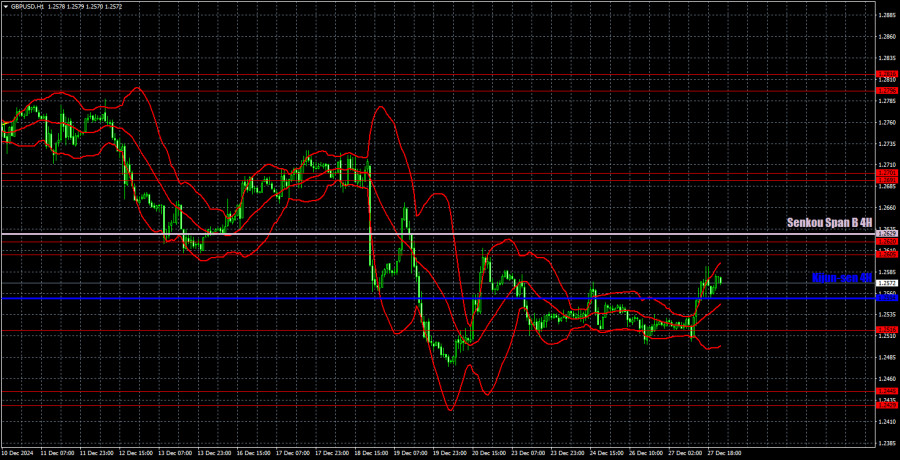

The GBP/USD currency pair saw significant growth on Friday, especially considering the holiday period. The price failed for the fourth consecutive time to break below the 1.2516 level, leading to a rebound and the start of a new upward movement. However, this overall movement remains confined within the 1.2516–1.2605 range, forming what can be described as a "holiday" horizontal channel. It is likely that the price will stay within this channel for another week, as there is expected to be little significant fundamental or macroeconomic news during this time.
We anticipate that the British pound will follow a similar trend to the euro and decline in the medium term. There are few reasons for the pound to appreciate, and this situation has diminished even further since December. The Bank of England has proven to be more dovish than the market had anticipated, while the Federal Reserve plans to reduce rates only twice next year—a stance that contradicts market expectations. As a result, we find ourselves in a situation where the market expected the Fed to take a more dovish stance and the BoE to be more hawkish. In reality, the opposite is occurring, which supports the strength of the dollar.
On Friday, the GBP/USD pair displayed high volatility, but the trading signals were not ideal. Initially, the price consolidated below the 1.2516 level, but this signal turned out to be false. Subsequently, a buy signal emerged near the same level, allowing the pound to appreciate by 70 pips. As a result, traders could have profited from these two trades; however, predicting such movements on a quiet holiday trading day proved to be extremely challenging.

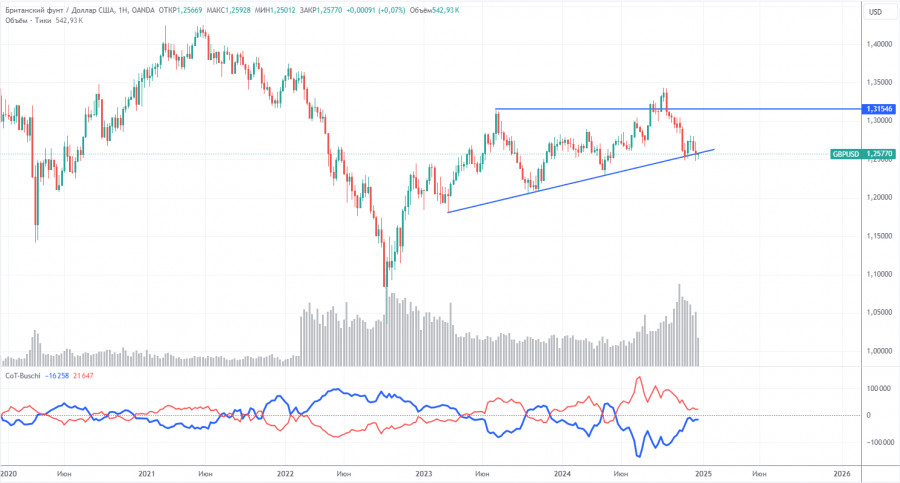
COT reports for the British pound indicate that sentiment among commercial traders has been fluctuating in recent years. The red and blue lines, representing the net positions of commercial and non-commercial traders, frequently intersect and tend to remain close to the zero mark. Recently, the price fell below the 1.3154 level and then dropped to the trend line. We believe that the price will likely consolidate below the trend line. The first rebound from the trend line—marking the fourth attempt overall—was quite weak. This setup suggests that the next attempt may succeed, potentially leading to a significant decline.
According to the latest COT report, the "Non-commercial" group closed 14,500 BUY contracts and 9,000 SELL contracts, resulting in a weekly decrease of the net position by another 5,500 contracts.
The current fundamental environment does not provide a strong rationale for long-term purchases of the British pound, and the currency appears to have a genuine chance of resuming its global downtrend. While the trend line is currently preventing further declines, failing to break below it could lead to another upward movement, possibly pushing the pound above the 1.3500 level. However, what fundamental reasons exist to justify such a move? The pound cannot continue to rise indefinitely without a solid basis.

On the hourly timeframe, the GBP/USD pair generally maintains a bearish outlook. The three-week corrective phase has come to an end, giving way to a new, holiday-driven phase. Currently, there are no fundamental reasons for the pound sterling to show growth, apart from occasional technical corrections. Although meetings of the BoE and the Fed could have negatively impacted the dollar, they ultimately had a more adverse effect on the pound. In the medium term, we anticipate a continued decline in the British currency.
For December 30, we have identified the following key levels: 1.2349, 1.2429-1.2445, 1.2516, 1.2605-1.2620, 1.2691-1.2701, 1.2796-1.2816, 1.2863, and 1.2981-1.2987. The Senkou Span B line at 1.2629 and the Kijun-sen at 1.2554 can also serve as potential signals. It is advisable to set a Stop Loss at breakeven once the price moves 20 pips in the desired direction. Please note that the Ichimoku indicator lines may shift throughout the day, which should be considered when identifying trading signals.
For Monday, no significant events or reports are scheduled in the UK or the US. As a result, there will be little analysis available, and the pound may continue its upward movement toward the 1.2605-1.2620 range.
Support and Resistance Levels (thick red lines): Key areas where price movement might stall. Not sources of trading signals.
Kijun-sen and Senkou Span B Lines: Ichimoku indicator lines transferred from the H4 timeframe to the hourly chart, serving as strong levels.
Extreme Levels (thin red lines): Points where the price has previously rebounded. They can serve as trading signal sources.
Yellow Lines: Trendlines, channels, or other technical patterns.
Indicator 1 on COT Charts: Reflects the net position size of each trader category.

QUICK LINKS