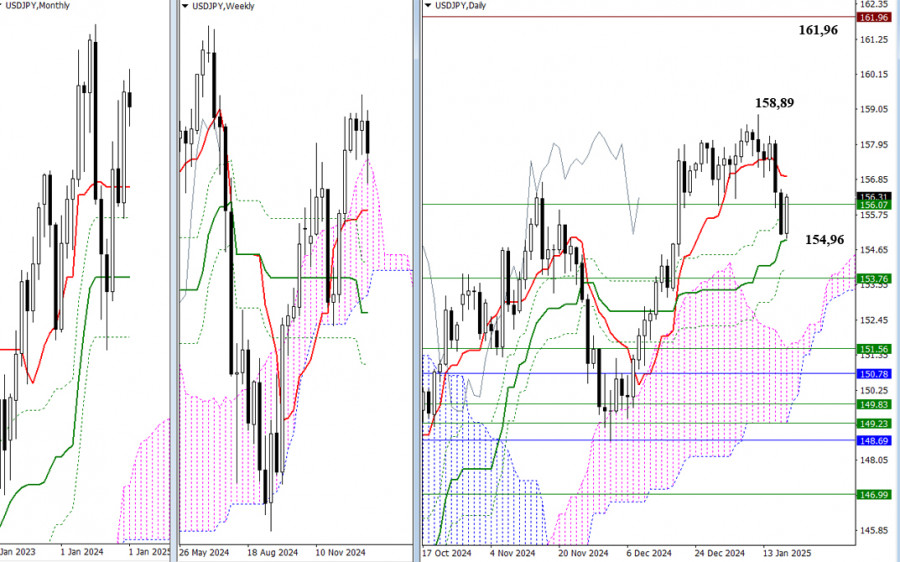
At the end of last week, we observed weekly consolidation, resulting in a long lower shadow reaching into the boundaries of the weekly Ichimoku cloud at 156.07. Sellers may now attempt to maintain the initiative needed to return to and consolidate within the weekly cloud. To do this successfully, they must first overcome the daily Ichimoku cross, which is situated between 154.96 and 154.03, and reclaim the weekly short-term trend at 153.76.
If sellers are unsuccessful and buyers manage to continue recovering their positions, the bulls will aim to regain the daily short-term trend at 156.94 and target a move out of the corrective zone at 158.89, which would allow them to resume the uptrend. Breaking the nearest high at 158.89 will restore the upward trend on both the daily and weekly timeframes. For the price to return to the monthly trend movement, it will need to surpass the monthly high at 161.96.
***
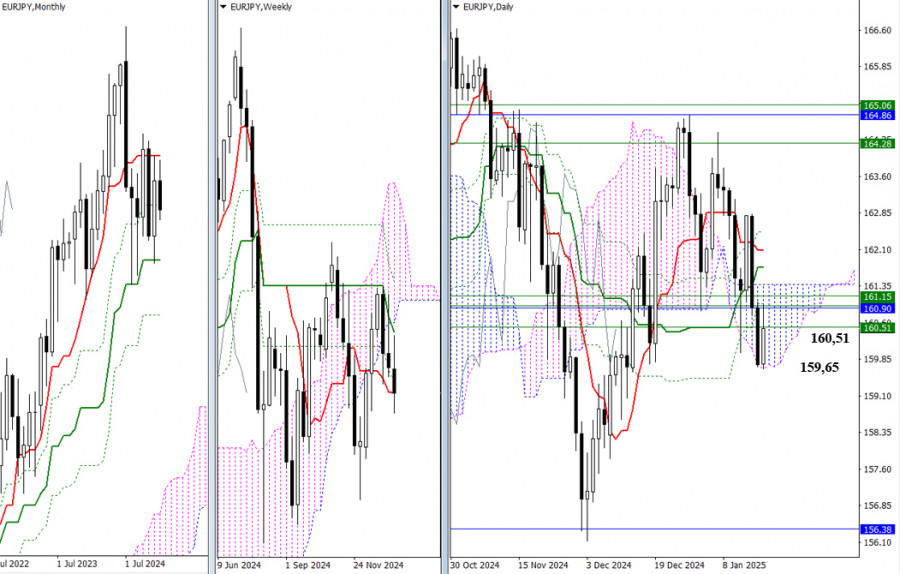
Last week, the EUR/JPY pair experienced a significant struggle. On Monday, buyers attempted to take control and initiate a corrective rally; however, their efforts were unsuccessful. Sellers managed to halt this rally, push the price to new lows, close below a critical support cluster, and reach the lower boundary of the daily Ichimoku cloud at 159.74.
On Friday, buyers launched another attempt, but the support cluster from Monday had transformed into resistance, which slowed the bullish recovery. This resistance zone, now reinforced by the daily Ichimoku cross, has expanded and lies between 160.51 and 162.46, with specific levels at 160.51, 160.90, 161.15, 161.38, 161.73, 162.08, and 162.46.
If buyers can break through this resistance zone, it could trigger a more sustained and significant bullish momentum. Conversely, if sellers maintain their position at these resistance levels, they will aim to push the price below the daily Ichimoku cloud at 159.65, targeting the monthly medium-term trend support at 156.38.
***

ລິ້ງດ່ວນ


 ຕິດຕໍ່ພວກເຮົາ

