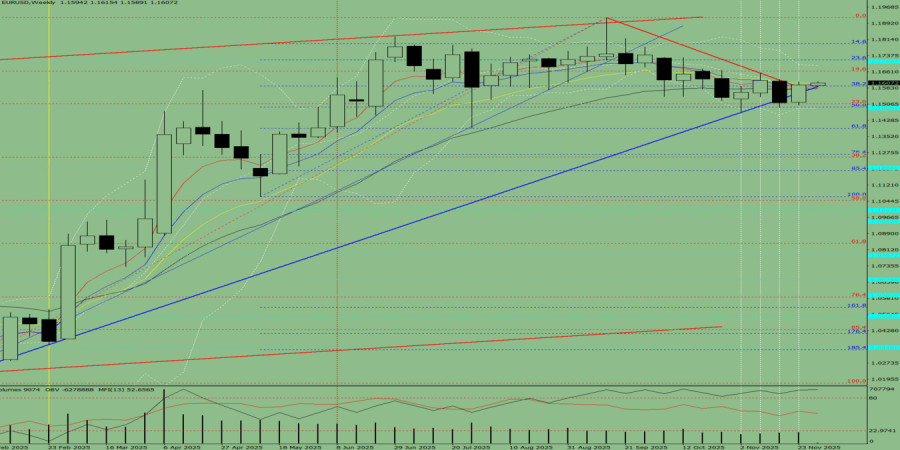
This week, from the level of 1.1598 (the close of the last weekly candle), the market may begin moving downward toward 1.1391 — the 61.8% retracement level (blue dashed line). When testing this level, the price may rebound upward toward 1.1488 — the historical resistance level (blue dashed line).
Fig. 1 (Weekly Chart).
Conclusion from comprehensive analysis: downward movement.
The price will most likely exhibit a downward tendency during the week, with the weekly bearish candle lacking the first upper shadow (Monday — down) and having a lower shadow (Friday — up).
From the level of 1.1598 (the close of the last weekly candle), the pair may begin moving downward toward 1.1492 — the 50% retracement level (blue dashed line). When testing this level, the price may rebound upward toward 1.1557 — the resistance line (bold blue line).


 コンタクトする

