Americké ministerstvo zahraničí schválilo první prodej pokročilých přesných zbraňových systémů pro zabíjení Saúdské Arábii za odhadovanou cenu 100 milionů dolarů, uvedl ve čtvrtek Pentagon.
Potenciální prodej přichází v době, kdy USA pokračují ve vlně úderů na húthiovské cíle v Jemenu, která začala minulou sobotu a při níž zahynulo nejméně 31 lidí v rámci největší takové operace od lednového návratu prezidenta Donalda Trumpa do Bílého domu.
Občanská válka v Jemenu vypukla koncem roku 2014, kdy se Hútíové zmocnili hlavního města Saná. Saúdská Arábie, znepokojená rostoucím vlivem šíitského Íránu podél svých hranic, vedla v březnu 2015 koalici podporovanou Západem, aby podpořila vládu podporovanou Saúdy.
Válka, která po uzavření příměří v roce 2022 polevila, zabila desítky tisíc lidí, zdevastovala jemenskou ekonomiku a miliony lidí trpí hladem.
Pokročilý zbraňový systém pro přesné zabíjení (APKWS) schválený k prodeji Saúdské Arábii je laserem naváděná raketa, která může zasáhnout vzdušné i pozemní cíle. Cena zbraně je přibližně 22 000 dolarů, což z ní činí cenově výhodnou volbu pro sestřelování levných malých ozbrojených dronů, jako jsou ty, které používají Hútíové a které narušují lodní dopravu v Rudém moři.
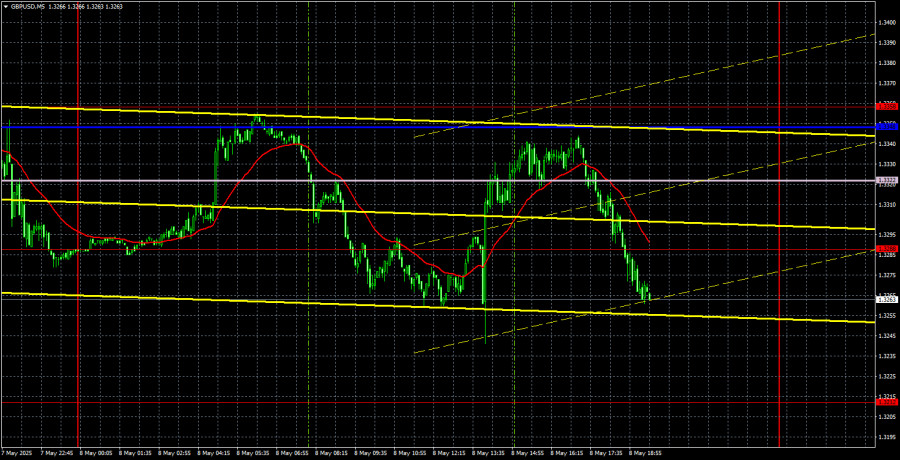
On Thursday, the GBP/USD currency pair continued trading within the sideways channel, visible in the hourly timeframe. Two central bank meetings — each of which could be considered favorable for the U.S. dollar — failed to trigger either an exit from the flat phase or any significant dollar strengthening. Meanwhile, EUR/USD managed to end its three-week flat phase, despite having fewer objective reasons to decline on Wednesday and Thursday. As we've said before, market movements have practically no logic.
The only factor that could be considered a win for the pound over the past two days is Donald Trump's declaration of a trade agreement between the United Kingdom and the United States. However, there are no details about the deal—no information on the terms, tariffs, or obligations—so the cause for celebration seems highly questionable. In any case, many questions about the recent moves in both currency pairs remain unanswered.
Technically, Thursday's trading in the pair was chaotic. The pair rose, then fell, then rose again, then fell once more. We didn't mark any trading signals on the chart illustration because all movements took place in a zone cluttered with technical levels and Ichimoku indicator lines every 30–40 pips. Opening trades in between such tight levels was simply pointless.
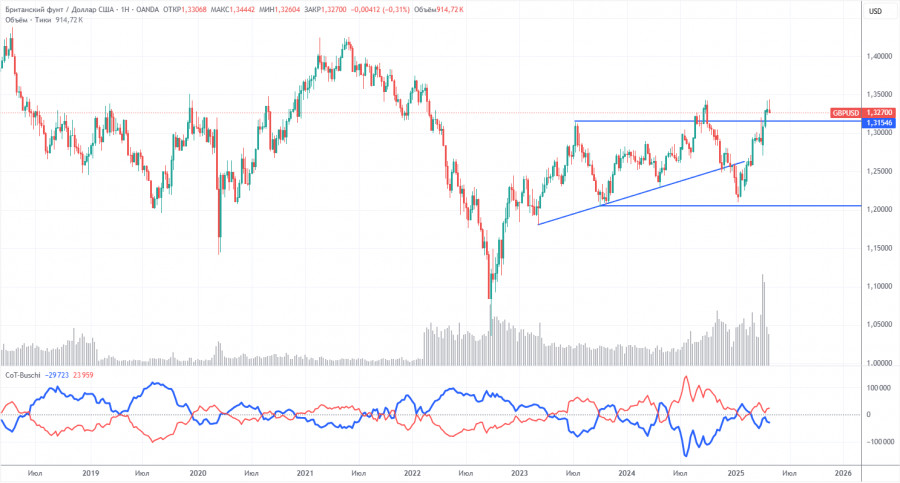
COT reports for the British pound show that commercial traders' sentiment has constantly shifted in recent years. The red and blue lines—representing net positions of commercial and non-commercial traders—frequently intersect and mostly hover near the zero mark. That's the case now, indicating a relatively balanced number of long and short positions.
On the weekly timeframe, the price initially broke through the 1.3154 level, then surpassed the trend line, returned to 1.3154, and broke it again. Breaking the trend line suggests a high probability of further pound depreciation. However, the dollar continues to fall due to Donald Trump. Therefore, despite technical signals, news about the trade war could keep pushing the pound higher.
According to the latest report on the British pound, the "Non-commercial" group closed 2,900 BUY contracts and 6,400 SELL contracts. As a result, the net position of non-commercial traders increased by 3,500 contracts.
The fundamental backdrop still does not justify long-term buying of the pound sterling, and the currency remains at real risk of resuming a broader downtrend. The pound has gained significantly recently, but it's important to understand that this was due to Donald Trump's policies.
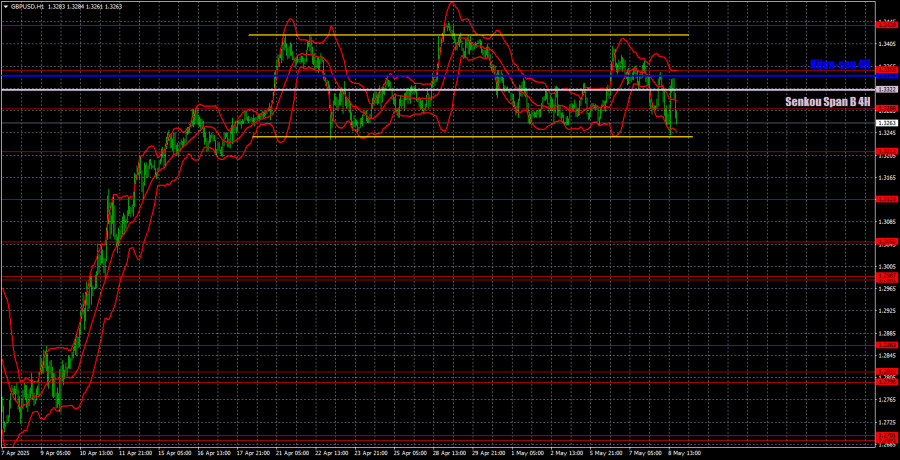
The GBP/USD pair shows an upward trend on the hourly timeframe, as the three-week flat phase hasn't invalidated the ongoing bullish trend. The pound has demonstrated robust growth in recent months, though it can hardly take credit for it — the movement has resulted mainly from the weakening U.S. dollar triggered by Donald Trump. That downward pressure on the dollar hasn't ended. The UK-U.S. trade deal has been signed but hasn't helped shield the dollar from Trump's future policy decisions. The Bank of England has cut rates, but the market seems unwilling to acknowledge it. As such, the market remains in chaos and disarray, with little to no logical consistency in price action.
Key trading levels for May 9: 1.2691–1.2701, 1.2796–1.2816, 1.2863, 1.2981–1.2987, 1.3050, 1.3125, 1.3212, 1.3288, 1.3358, 1.3439, 1.3489, 1.3537. Ichimoku lines: Senkou Span B (1.3322) and Kijun-sen (1.3348) can also act as signal levels. To protect from false signals, place a Stop Loss at breakeven once the price moves 20 pips in the right direction.
No important events are scheduled in the UK or the U.S., aside from a speech by BoE Governor Andrew Bailey. It's unclear what new information Bailey could offer the day after the Bank's policy meeting, but officially, the event could still trigger some market reaction. A firm break below the flat range would indicate that — like the euro — the pound may be preparing for a decline. However, such a drop may be limited in scale.


 コンタクトする

