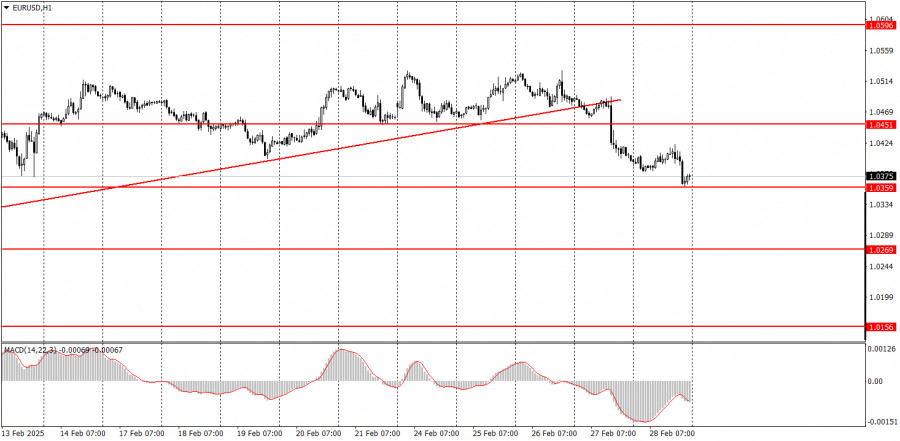
The EUR/USD currency pair continued its downward movement on Friday, which began after breaking the trendline. From a technical perspective, the euro's decline was both expected and logical. Regarding the macroeconomic background on Friday, traders had every reason to anticipate its impact on the pair's movements. However, in reality, there was no influence at all. The most volatile period on Friday occurred late in the evening, while all relevant reports from the EU and the US were published much earlier.
Additionally, the German economic reports were unimpressive. Unemployment and inflation figures matched forecasts, while retail sales showed only a slight deviation from expectations. In the US, three reports were released, but we considered them secondary right away, and they had no impact on trading.
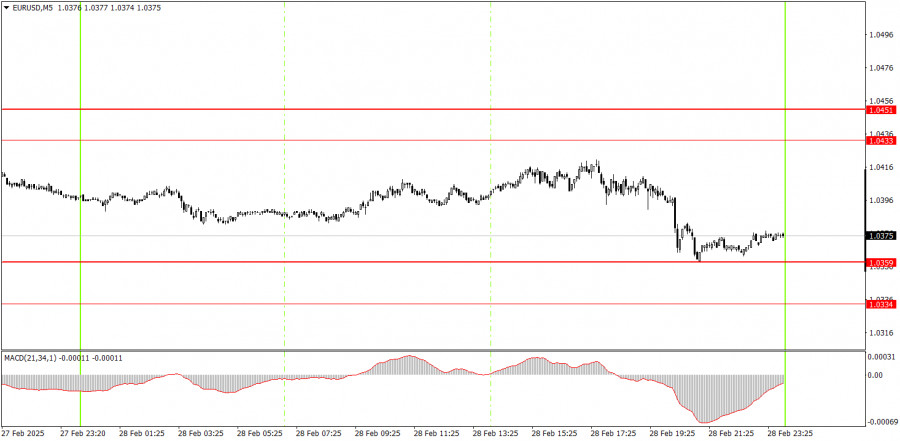
On the five-minute chart, no trading signals were formed on Friday. The price tested the 1.0359 level once, rebounding from it. However, a buy signal did appear just an hour before the market closed for the weekend, suggesting that Monday could start with a gap in either direction.
In the hourly timeframe, the EUR/USD pair remains in a medium-term downtrend and has a range-bound movement on the daily chart. As before, a decline in the euro should be expected, as the fundamental and macroeconomic background continues to favor the US dollar much more than the euro. We may see a few more trend movements on the hourly chart before the main decline resumes, but in the short term, we anticipate a local drop.
The euro's decline may continue on Monday, but where the price opens at night will be crucial. It is worth noting that on Saturday night, a minor scandal involving President Trump occurred in the White House. The market may react strongly to this event when trading resumes on Monday.
On the five-minute chart, key levels to watch on Monday are 1.0156, 1.0221, 1.0269-1.0277, 1.0334-1.0359, 1.0433-1.0451, 1.0526, 1.0596, 1.0678, 1.0726-1.0733, 1.0797-1.0804, and 1.0845-1.0851. Business activity indices in the manufacturing sector will be released in Germany, the EU, and the US, focusing on the US ISM index. The EU will also release its February inflation report, which could strongly impact the euro.
Support and Resistance Levels: These are target levels for opening or closing positions and can also serve as points for placing Take Profit orders.
Red Lines: Channels or trendlines indicating the current trend and the preferred direction for trading.
MACD Indicator (14,22,3): A histogram and signal line used as a supplementary source of trading signals.
Important Events and Reports: Found in the economic calendar, these can heavily influence price movements. Exercise caution or exit the market during their release to avoid sharp reversals.
Forex trading beginners should remember that not every trade will be profitable. Developing a clear strategy and practicing proper money management are essential for long-term trading success.

QUICK LINKS


 Contact Us

