The EUR/USD currency pair experienced a significant drop on Thursday. For over a week, the price had been hovering near the upper boundary of a sideways channel on the daily timeframe, but it never broke through the 1.0524 level. Eventually, the price consolidated below an ascending trend line that had long acted as support. Once this happened, it became clear that the euro was poised for another decline, particularly since there had been no supportive fundamental or macroeconomic factors for the euro in recent weeks.
During the first three days of the week, there were no major reports or news. However, on Thursday, Trump once again announced tariffs against the EU, with the effective date unspecified. Additionally, two key U.S. economic reports showed relatively strong results, sealing the euro's fate.
Looking ahead, we still expect the EUR/USD pair to fall below parity. However, it's important to note that the euro is not like Bitcoin, which can lose 20% of its value in just a week. Any decline is likely to take time. On the hourly timeframe, the price needs to break below the Senkou Span B line, which would further open the path for continued downward movement.
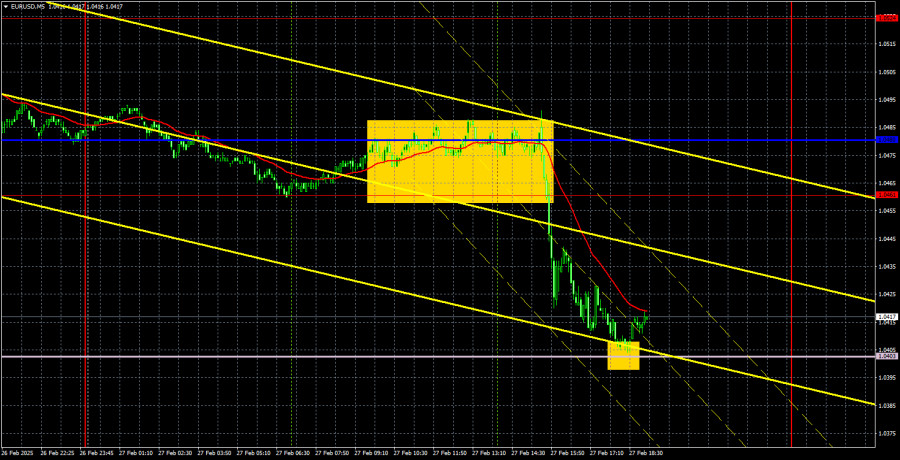
Two trading signals formed on Thursday in the 5-minute timeframe. After the release of the U.S. reports, a sell signal emerged in the 1.0461-1.0480 range, leading to a decline toward the Senkou Span B line, which the price tested before bouncing. Even from this trade alone, a profit of 30-40 pips could have been secured. However, as the drop was sharp, entering at the very start would have been difficult. We would not have traded the bounce off the Senkou Span B line.
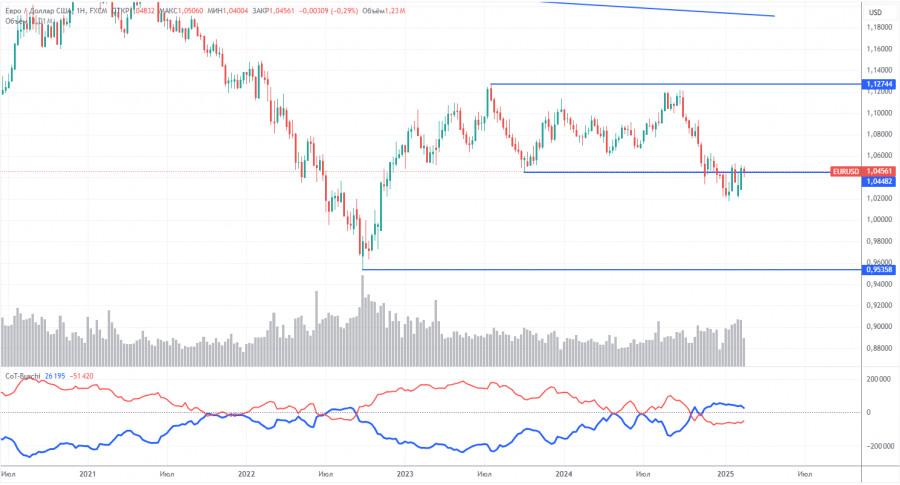
The latest COT report, dated February 18, indicates that the net position of non-commercial traders remained bullish for an extended period. However, bears have recently gained dominance in the market. Three months ago, there was a significant increase in the number of short positions taken by professional traders, resulting in a negative net position for the first time in a long while. This trend suggests that the euro is being sold more frequently than it is being purchased, leading to a prevailing bearish sentiment.
Currently, there are no fundamental factors supporting a strengthening of the euro. The upward movement observed in the weekly timeframe is minimal and appears to be a mere correction. The currency pair may continue to correct for several weeks or even months; however, this does not alter the long-term downtrend that has persisted for 16 years.
At present, the red and blue lines in the COT report have crossed and switched positions, indicating a bearish trend in the market. During the most recent reporting week, the number of long positions in the "Non-commercial" group increased by 4,700, while short positions decreased by 8,200. As a result, the net position grew by 12,900 contracts; nonetheless, this change does not significantly impact the overall market sentiment.
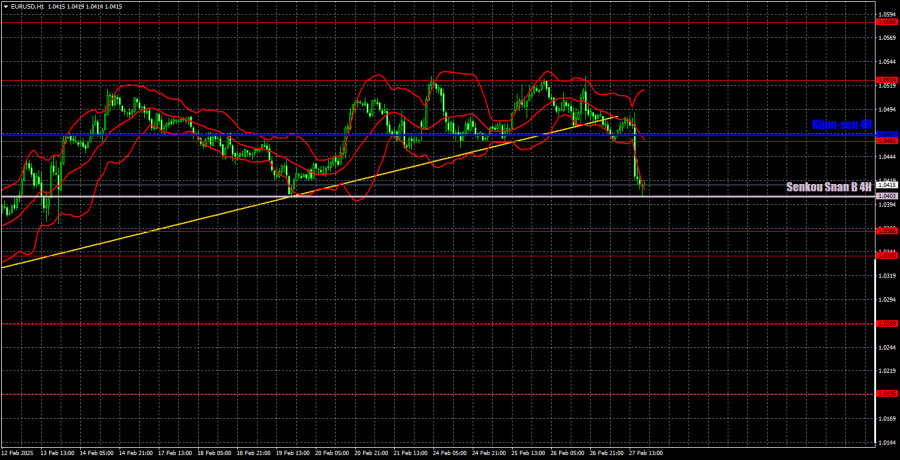
On the hourly chart, the pair has finally begun the anticipated decline. We believe this downtrend will continue in the medium term, given that the Federal Reserve may only cut rates once or twice in 2025, while the European Central Bank is likely to make more aggressive cuts. However, we could see another one or two upward movements in the short term due to prolonged corrective phases on the daily chart. Fundamentally, the euro has no strong reason to rise—it has been rallying primarily due to technical factors.
For February 28, key trading levels include 1.0124, 1.0195, 1.0269, 1.0340-1.0366, 1.0461, 1.0524, 1.0585, 1.0658-1.0669, 1.0757, 1.0797, 1.0843, along with the Senkou Span B (1.0403) and Kijun-sen (1.0467) lines. The Ichimoku indicator lines may shift throughout the day, which traders should consider when interpreting trading signals. A Stop Loss order should be placed at breakeven once the price moves 15 pips in the right direction to minimize potential losses from false signals.
The Eurozone and Germany will release unemployment, inflation, and retail sales data on Friday. While not game-changing, these reports could still trigger some market reactions. In the U.S., the PCE index and personal income/spending data will be published, though these are not considered top-tier reports.

QUICK LINKS


 Contact Us

