
The EUR/USD currency pair continues to sluggishly slide downward. Friday changed absolutely nothing, despite a strong macroeconomic backdrop. On the last trading day of last week, at least reports on the U.S. labor market and unemployment were published, but even they were not enough to push volatility above the usual level. And the "usual" is small now. EUR/USD continued its decline, which fits the current technical picture on both the hourly and daily timeframes. On the hourly chart, we have a downward trend with a trendline, and on the daily, a flat and a retest of its upper boundary. Therefore, the U.S. dollar may continue to rise on technical factors alone. Overall, the American currency has been rising for three weeks. The pair's decline began on December 24. During this time, the dollar has risen by 180 pips. That is neither little nor large. The move down is not strong, but it is daily.
Back to the U.S. reports. Nonfarm Payrolls came in below already very weak forecasts, while the unemployment rate fell by 0.1%. However, we do not consider that U.S. unemployment is in a downward trend. Rather, it has been rising for three years. The University of Michigan consumer sentiment index came in higher than expected, so, overall, with considerable reservations, the U.S. data package can be considered positive for the dollar.
On the 5-minute TF on Friday, two sell trading signals were formed in the area 1.1657–1.1666. In the second case, the price fell about 30 pips... Market volatility remains extremely weak even on days when the macroeconomic backdrop is very strong.
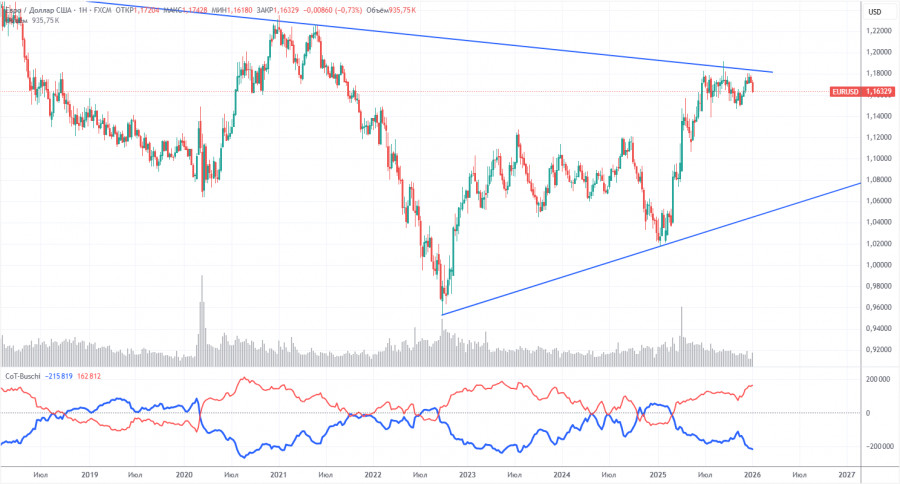
The latest COT report is dated January 6. In the illustration above, it is clear that the net position of non-commercial traders was bullish for a long time; bears barely moved into a zone of their own superiority at the end of 2024, but quickly lost it. Since Trump took office for a second time as U.S. president, only the dollar has been falling. We cannot say the dollar's decline will continue with 100% probability, but current global developments hint at that scenario. The red and blue lines are moving apart, indicating strong bull dominance.
We still do not see any fundamental factors that would strengthen the European currency, while there remain sufficient factors that would weaken the American one. The global downward trend still persists, but what does it matter now where the price moved over the last 17 years? Over the past three years, only the euro has been rising, and that is also a trend.
The positions of the red and blue lines of the indicator continue to indicate the preservation and strengthening of the bullish trend. During the last reporting week, the number of longs in the "Non-commercial" group increased by 3,500, and the number of shorts decreased by 1,800. Accordingly, the net position for the week grew by another 5,300 contracts.
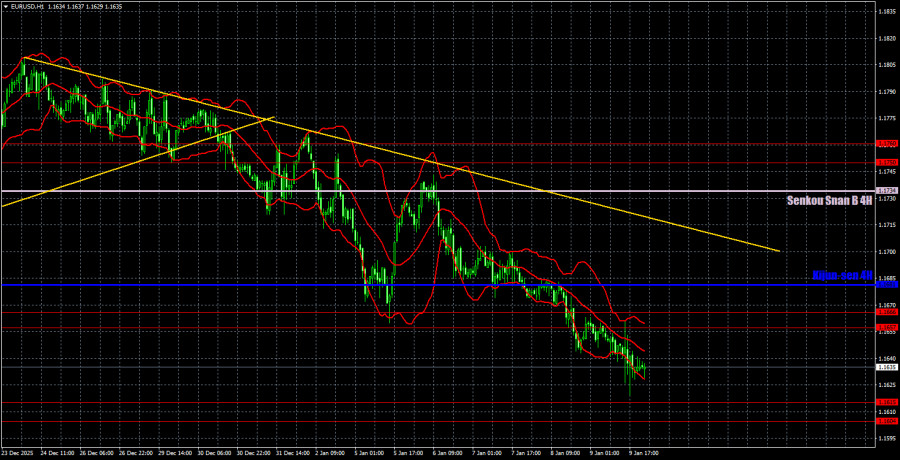
On the hourly timeframe, the EUR/USD pair continues forming a downward trend. In fact, the upper line of the horizontal channel 1.1400–1.1830 was tested twice, and the euro failed to break out of it. Thus, technically, the pair's decline is logical. To count on euro appreciation and a new attempt to overcome the 1.1800–1.1830 area, one should wait for a breakout of the trendline.
For January 12, we highlight the following levels for trading: 1.1234, 1.1274, 1.1362, 1.1426, 1.1542, 1.1604–1.1615, 1.1657–1.1666, 1.1750–1.1760, 1.1846–1.1857, 1.1922, 1.1971–1.1988, as well as the Senkou Span B line (1.1734) and the Kijun-sen (1.1681). Ichimoku indicator lines may move during the day, which should be taken into account when determining trading signals. Do not forget to move the Stop Loss to breakeven if the price has moved 15 pips in the correct direction. This will protect against possible losses if the signal turns out to be false.
On Monday, the Eurozone inflation data for Germany is scheduled, and in the U.S., the industrial production for December is scheduled. We cannot call either of these reports important. Last week, volatility remained low despite several important events.
On Monday, traders may trade from the area 1.1657–1.1666 or from the area 1.1604–1.1615. A rebound from the 1.1604–1.1615 area will allow opening long positions with a target of 1.1657, while a close below it will be shorts with a target of 1.1542.

RYCHLÉ ODKAZY


 Kontaktujte nás

