Společnost Samsung Electronics, světový lídr v oblasti chytrých telefonů, televizorů a paměťových čipů, podle zdrojů obeznámených se situací údajně snižuje až 30 % svých zahraničních zaměstnanců v některých divizích. Plán snižování nákladů se dotkne pracovních míst v Americe, Evropě, Asii a Africe a měl by být realizován do konce roku. Společnost nařídila dceřiným společnostem snížit počet zaměstnanců v oblasti prodeje a marketingu přibližně o 15 % a počet administrativních pracovníků až o 30 %. Celkový počet zaměstnanců, kteří budou propuštěni, a nejvíce postižené země a obchodní jednotky zůstávají nejasné. Společnost Samsung uvedla, že úpravy pracovních sil jsou rutinní a jejich cílem je zvýšit efektivitu. Zpráva přichází v době, kdy Samsung čelí problémům ve svém podnikání v oblasti čipů, rostoucí konkurenci na trhu prémiových chytrých telefonů a stávkám kvůli mzdám, které narušují výrobu v Indii. Akcie společnosti Samsung Electronics klesly na nejnižší úroveň za posledních 16 měsíců, zatímco někteří analytici revidovali odhady zisku s odkazem na slabou poptávku po chytrých telefonech a osobních počítačích.
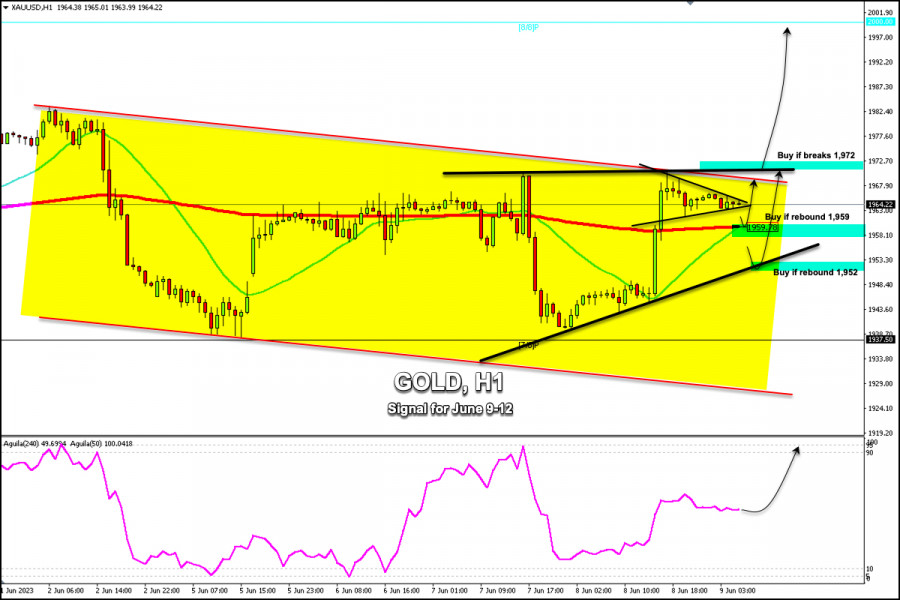
Early in the European session, Gold (XAU/USD) is trading around 1,964.22, above the 21 SMA and above the 200 EMA. Yesterday, the metal recovered from the previous day's sharp decline and is now consolidating to resume its bullish cycle.
Yesterday, gold rallied from a low of 1,939.71, reaching a high of 1,970.64. The US dollar weakened which also affected the strength of US bond yields.
This favored the technical rebound of gold, so the price reached resistance levels around the top of the bearish channel. A recovery of around $30 means that gold could be preparing for a bullish move in the next few days and could reach the psychological level of $2,000. Treasury yields are now falling, with the 10-year yield trading at 3.71%.
The disappointing report from the United States related to employment was worse than expected by analysts. Initial claims for unemployment benefits reached 261,000, expected to fall below 236,000.
According to the 1-hour chart, the odds favor a continuation of the bullish movement in the short term, although gold is showing signs of exhaustion. A sharp break above the top of the uptrend channel around 1,970 could support gold higher and it could reach 1,987 and 8/8 Murray around $2,000.
While gold trades below the key 1,970 level, it is expected to come under strong bearish pressure and the metal could reach the 200 EMA, the zone coinciding with the 21 SMA located at 1,959. In the event of a break, this could push gold down to the bottom of the symmetrical triangle around 1,952. The price action could offer a strong technical bounce.
Our trading plan for the next few hours is to wait for gold to make a technical correction until it reaches the 1,959 zone, which could be seen as an opportunity to buy, with targets at about 1,967. On the other hand, if bearish pressure prevails, we could expect a key bounce zone around 1,952. This move could be used as a buying opportunity with targets at 1,970 and $2,000.


 联系我们
联系我们 

