Morgan Stanley zvýšil své cenové cíle pro skupinu akcií polovodičových společností s odkazem na „výjimečnou“ poptávku po čipech pro umělou inteligenci ze strany hyperscalerů a spotřebitelských internetových společností.
Banka uvedla, že nárůst nadšení investorů je „odůvodněn dlouhodobou silou tohoto odvětví“ a dodala, že „naše přesvědčení o trvalosti výdajů na umělou inteligenci v roce 2026 nadále roste“.
Nvidia (NASDAQ:NVDA) zůstává nejlepším tipem společnosti, přičemž její cenový cíl se zvýšil ze 170 USD na 200 USD. Analytici poukázali na produktový cyklus Blackwell a silnou poptávku převyšující dodávky.
„Růst bude i nadále určovat nedostatek dodávek, ale ve druhé polovině roku by se nabídka měla zlepšit,“ uvedli.
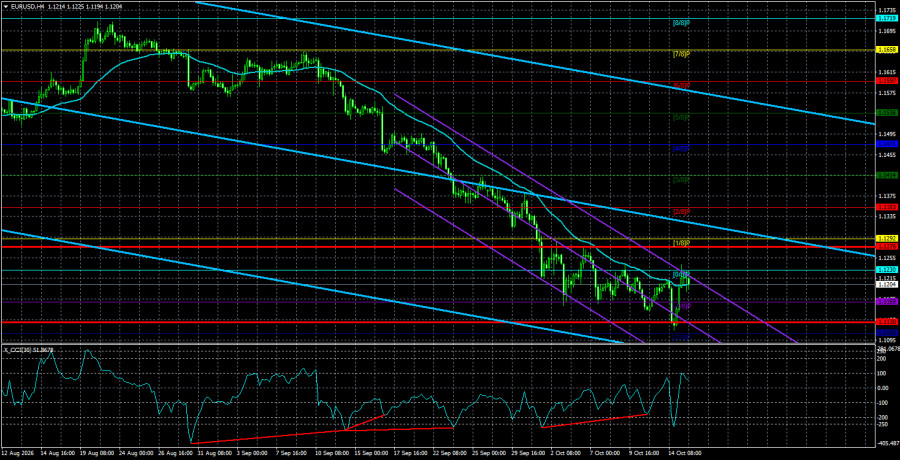
The EUR/USD currency pair rallied sharply on Thursday, which immediately panicked dollar bulls. Analysts scrambled to explain why the US currency fell after nearly a month of almost daily gains. People quickly get used to good news, and not everyone bothers to check whether there are real reasons for a move. In any unclear situation, it's much easier to cite "rising risk-off sentiment," "increasing geopolitical tensions," or "a stronger Fed hawkish stance." Those three explanations can justify almost any dollar rally at any time.
So what happened on Wednesday? Why did the market first drop about 100 pips and then rally about 130 pips? Did the US inflation report confuse traders? First, the report itself. US headline CPI rose to 3.7% — only 0.1 percentage point above forecasts. Core CPI rose to 2.6% — also only 0.1 percentage point above forecasts. No one denies inflation is rising and the Federal Reserve must respond with tightening. But right now most of the discussion concerns two hikes in total. In other words, whether inflation rises a bit or not, the Fed is still targeted toward roughly two rate increases.
Recall the Fed delivered its first hike in three years in September, even though inflation was falling at the time. In May, CPI was 4.2% and in August only 3.4%—and that didn't stop the Fed from tightening. Why? Because the Fed looks at other indicators and works from its own projections. For traders, headline and core inflation figures are a reference, but they are not the Fed's only guide. Inflation rising to 3.7% was not unexpected — a slowdown was not anticipated. "The Fed will continue tightening in December" was already priced in; no one expected a materially different outcome even before the unlucky inflation print.
Put simply, the inflation report changed nothing. Even the market didn't meaningfully raise its hawkish expectations, as it sometimes does. The probability of an October hike remains minimal. So what drove the dollar's drop? The inflation report was merely the trigger or the pull of the trigger. The dollar had risen almost every day for a month, with virtually no pullbacks or corrections. How long was that supposed to continue? The CCI formed four bullish divergences and entered overbought territory five times. On daily and weekly charts, the recent downward move is clearly a correction. The dollar has no remaining fundamental drivers left to push it higher (no unpriced factors). Can the dollar really keep rising against the euro and the pound for a whole month simply because the Fed plans two hikes — while the European Central Bank has already tightened twice and the Bank of England appears set for three tightenings?
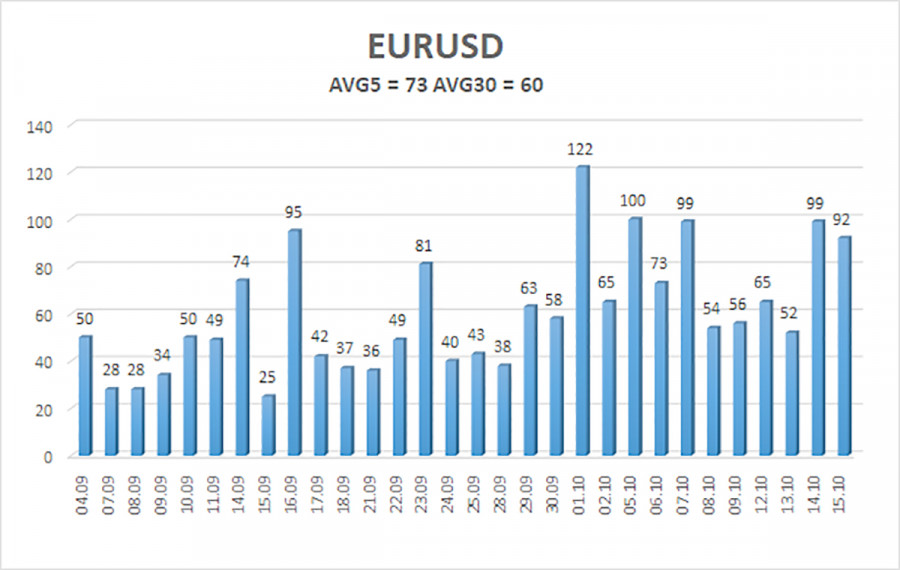
The average volatility of the EUR/USD currency pair over the last 5 trading days as of October 16 is 73 pips and is characterized as "average." We expect the pair to move between the levels 1.1130 and 1.1276 on Friday. The higher linear-regression channel has turned down, indicating another trend change. The CCI indicator entered the oversold area for the fifth time and formed four "bullish" divergences, warning of the end of the illogical downtrend. However, the market is not responding to technical signals.
S1 – 1.1169
S2 – 1.1108
R1 – 1.1230
R2 – 1.1292
R3 – 1.1353
The EUR/USD pair continues to move downward, but we still view the decline as a correction before a new uptrend. The global fundamental backdrop for the dollar remains negative, but in 2026, geopolitics and then the Fed's hawkish stance provided strong support to the US currency. With price positioned below the moving average, short positions are possible, targeting 1.1130 and 1.1108. Above the moving average, long positions are relevant, targeting 1.1276 and 1.1292.



















 আমাদের সাথে যোগাযোগ করুন