The GBP/USD currency pair also traded higher on Monday despite no clear reasons or fundamental grounds for this movement. However, the pound has risen even on days when the euro paused its "northern trajectory." Therefore, on Monday—when the dollar collapsed across the board once again—it would have been strange not to see the British currency strengthening.
The reasons for the dollar's latest collapse have already been discussed in the EUR/USD article, so we won't repeat them here. Instead, this piece will focus on another important point. During Trump's second term, the US dollar fell by 13% against the euro and 10% against the pound. That may not seem like much, but what are the implications?
Let's assign the dollar a nominal value of 1. If the USD depreciates, investors receive lower returns on US government bonds, deposits, or stocks. When the dollar drops quickly, even a 2% return in the EU or China becomes more attractive than 10% in the US. A falling dollar effectively equals inflation—not in the classic sense where all goods rise in price, but it is still inflationary.
Almost all imports in the US will become more expensive, which means rising prices. And keep in mind that American consumers haven't even fully felt the impact of higher import prices yet since Trump's tariffs are still relatively new. But the dollar has already dropped by at least 10%. Add another 25% in average import tariffs—it's not hard to calculate the losses for everyone connected to the American economy.
Trump wants to eliminate the budget deficit, reduce national debt, cut taxes, and fix the trade imbalance. But even if those goals were achieved (and they're not even close), they would lose significance if the dollar dropped by 20%, for example. So, on a regular, quiet post-holiday Monday, we see another routine 100-pip dollar decline. Simply because the idea of "buying the dollar" doesn't exist in the market right now.
Celebrities are fleeing America, US products are being boycotted globally, and US consumers are protesting against Donald Trump. Of the many difficult tasks Trump promised to solve, none has been achieved. The war in Ukraine continues, the US economy is slowing, the dollar is collapsing, and the US stock market is enduring dark times. What has Trump accomplished? He signed a law defining two genders and withdrew the country from "useless" projects and organizations. What was the benefit? Did halting funding for Harvard save the US much money?
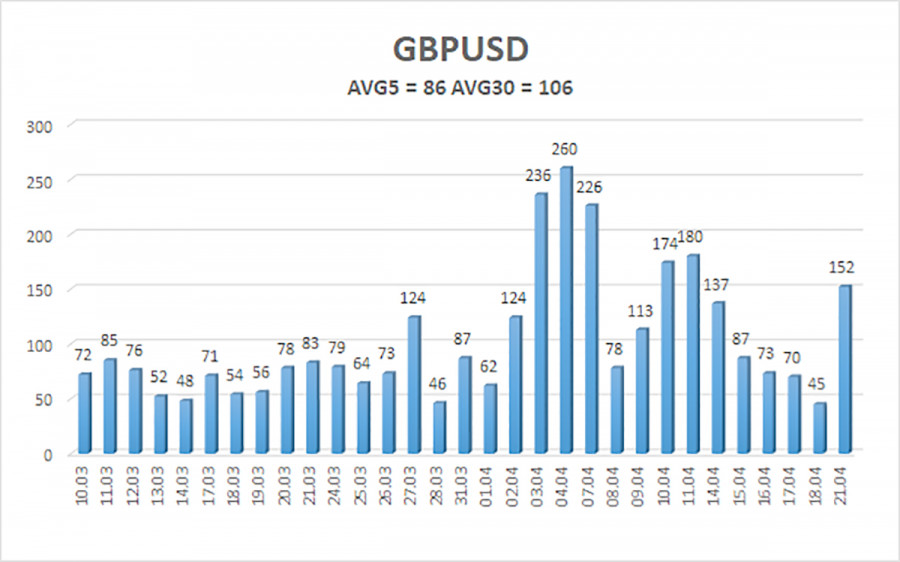
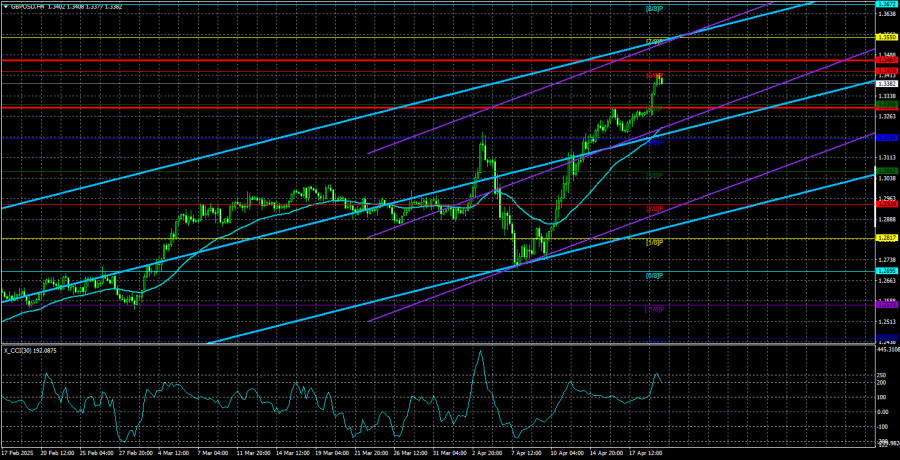
The average volatility of GBP/USD over the last five trading days is 86 pips. For the GBP/USD pair, this is considered "average." Therefore, on Tuesday, April 22, we expect movement within the range bounded by 1.3295 and 1.3467. The long-term regression channel points upward, indicating a clear uptrend. The CCI indicator has once again entered the overbought zone, but during a strong upward trend, this usually only signals minor corrections.
S1 – 1.3306
S2 – 1.3184
S3 – 1.3062
R1 – 1.3428
R2 – 1.3550
R3 – 1.3672
The GBP/USD currency pair continues its confident upward movement. We still believe that the entire uptrend is a correction on the daily timeframe, which has already become illogical. However, if you're trading based on "pure technicals" or "on Trump," long positions remain relevant with targets at 1.3467 and 1.3550, as the price is above the moving average. Moreover, the pound keeps rising every day—even without justification. Sell orders are still attractive, with targets at 1.2207 and 1.2146, but for now, the market isn't even considering buying the dollar, and Donald Trump continues to provoke new sell-offs of the American currency.
Linear Regression Channels help determine the current trend. If both channels are aligned, it indicates a strong trend.
Moving Average Line (settings: 20,0, smoothed) defines the short-term trend and guides the trading direction.
Murray Levels act as target levels for movements and corrections.
Volatility Levels (red lines) represent the likely price range for the pair over the next 24 hours based on current volatility readings.
CCI Indicator: If it enters the oversold region (below -250) or overbought region (above +250), it signals an impending trend reversal in the opposite direction.


 আমাদের সাথে যোগাযোগ করুন

