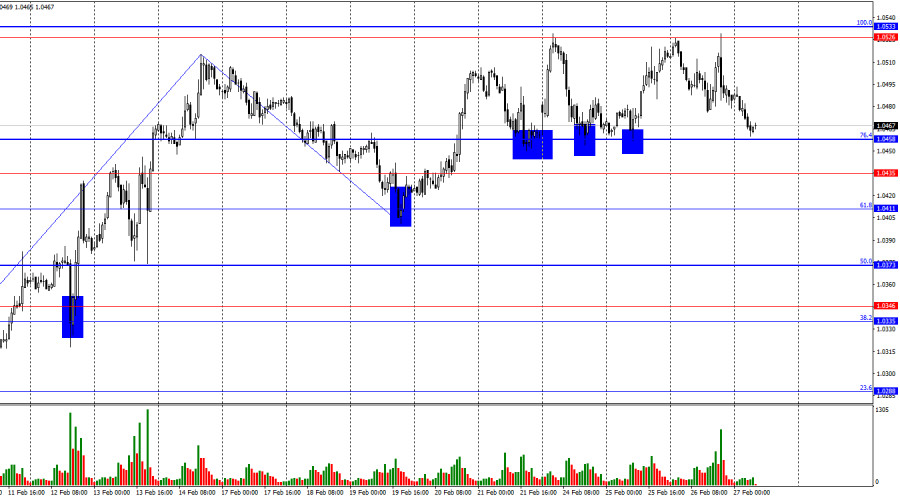
On Wednesday, the EUR/USD pair made a new rise into the resistance zone of 1.0526–1.0533, then reversed in favor of the US dollar, resulting in a decline back to the 76.4% retracement level at 1.0458. A bounce from the 1.0458 level could support the euro and trigger new growth towards the 1.0526–1.0533 zone. Conversely, holding below 1.0458 would indicate a continued decline toward 1.0435 and 1.0411. Currently, the pair is in a horizontal range.
The wave structure on the hourly chart has become somewhat ambiguous, but bullish trend signals remain evident. The last completed downward wave did not break the previous low, and the new upward wave surpassed the previous peak. Thus, the market is either in a bullish trend or showing a complex horizontal movement, which is more apparent on the 4-hour chart.
On Wednesday, the news flow was once again very weak, limiting market volatility. However, Donald Trump delivered another market shock. Discussions about EU import tariffs have been ongoing for a while, but it seems that the longer Trump remains president, the more antagonistic he becomes toward the world.
Despite positive negotiations with French President Emmanuel Macron, Trump announced 25% tariffs on all imports from the European Union the very next day. According to him, the EU was created to exploit America.
The EU has repeatedly stated that if Washington imposes tariffs, it will respond immediately and with equal force. Thus, we can confidently say that a second trade war—this time between the US and the EU—is beginning. Notably, the US dollar has again strengthened on trade-related news, but it remains in a horizontal range.
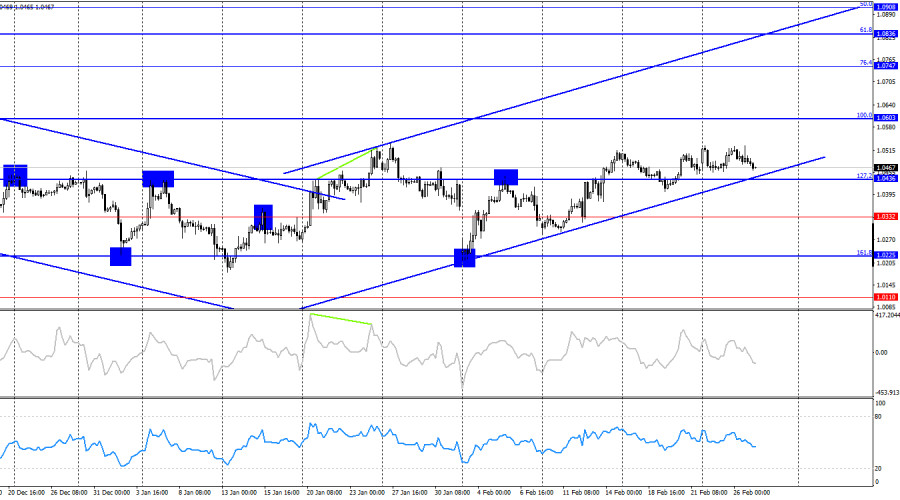
On the 4-hour chart, the pair returned to the 127.2% retracement level at 1.0436 and held above it. However, the chart shows that in 2025, the market primarily exhibited horizontal movement—a sideways trend.
The upward trend channel appears nominal, as the price does not respect it and lacks momentum to grow within it. No divergences are currently observed across any indicators.
Commitments of Traders (COT) Report
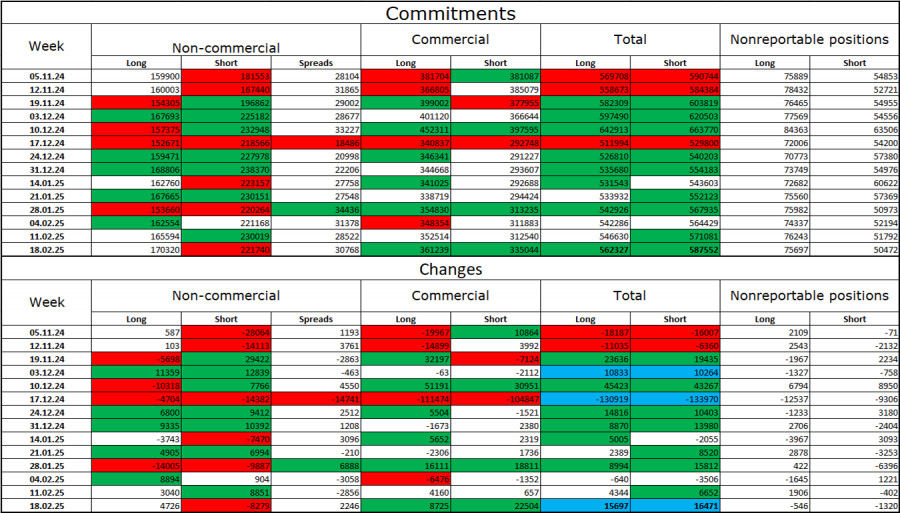
In the last reporting week, professional traders opened 4,726 long contracts and closed 8,279 short contracts. The sentiment in the 'Non-commercial' group remains bearish.
For 21 weeks in a row, major players have been selling the euro, indicating a clear bearish trend. Occasionally, bulls dominate during individual weeks, but these are exceptions rather than the rule.
The key factor driving the dollar's decline—expectations of FOMC monetary easing—has played out, leaving the market with fewer reasons to sell the dollar.
Recently, a series of news from both the EU and the US has allowed bulls to regain some ground. The bearish advantage is weakening, but it is too early to call an end to the bearish trend. The number of long positions has been increasing for three consecutive weeks.
News Calendar for the US and Eurozone
On February 27th, the economic calendar features three entries, with two being particularly important. The influence of the news on market sentiment is expected to be moderate, particularly in the second half of the day.
EUR/USD Trading Outlook and Advice
Selling Opportunities: Sales were possible on a rebound from the 1.0526–1.0533 zone on the hourly chart, targeting 1.0458.
Buying Opportunities: Buys are viable on a bounce from the 1.0458 level, with targets in the 1.0526–1.0533 zone.
Additional Sales Scenario: Sales can also be considered if the hourly chart closes below 1.0458, aiming for 1.0435 and 1.0411.
Fibonacci Level Grids:


 আমাদের সাথে যোগাযোগ করুন

