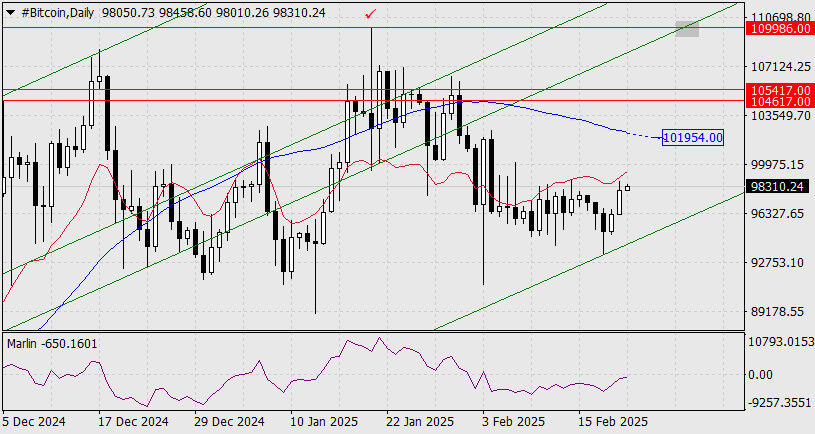
Bitcoin has chosen not to decline further toward key support levels. Instead, in response to the broader risk sentiment, it reversed from the lower boundary of the ascending price channel on February 18 and has been on an upward trajectory for the third consecutive day.
The Marlin oscillator supports this upward movement and is attempting to enter positive territory. The initial target for this uptrend is the MACD line around 101,954. If this level is broken, the target range expands to between 104,617 and 105,417, with the lower boundary defined by the high on December 5, 2024. A breakout above this range could push Bitcoin towards the peak of 109,986 reached on January 20 (indicated by a checkmark), as well as the line of the embedded price channel (illustrated by a gray rectangle). A slight overshoot beyond this peak could cause a divergence on the daily chart, potentially setting the stage for a medium-term decline in Bitcoin's price.

On the four-hour chart, the price is consistently rising above the indicator lines, and the Marlin oscillator is also climbing, though there is still considerable room before reaching overbought conditions. Overall, the trend remains bullish, which is the primary scenario for now.


 আমাদের সাথে যোগাযোগ করুন

