KeyBanc Capital Markets ve čtvrtek zvýšil hodnocení Microsoftu (NASDAQ:MSFT) na „nadváhu“ a zvrátil tak své dubnové snížení hodnocení. Jako klíčový faktor, který „řeší všechny problémy“, uvedl silnější než očekávaný růst Azure.
Broker obnovil cílovou cenu 630 USD s tím, že Microsoft „posílil argumenty pro pozitivní výhled téměř ve všech oblastech“.
K tomuto kroku došlo poté, co Microsoft oznámil výsledky, které překonaly očekávání, s EPS 3,65 USD oproti konsensu 3,37 USD a tržbami 76,4 mld. USD, což je více než odhad 73,79 mld. USD.
Tržby z cloudu dosáhly za čtvrtletí 29,9 mld. USD.
KeyBanc jako hlavní důvod zvýšení hodnocení zdůraznil zrychlení růstu Azure. „Růst Azure se ve druhé polovině roku zrychlil o osm procentních bodů v konstantní měně, z 31 % v lednu na 35 % v březnu a na 39 % na konci roku,“ uvedli analytici.
„Poslední dvě čtvrtletí učinila debaty prozatím zcela irelevantními,“ dodali.
Azure v posledních dvou čtvrtletích překonal prognózy o 500 milionů a 700 milionů dolarů. „Je to jako najít Monday.com v polštáři na gauči,“ řekl tým KeyBanc.
„Právě kvůli takovým překvapením děláme to, co děláme.“
The EUR/USD currency pair basically stood still all day Thursday, aside from an overnight rally as part of a double reaction to the recent US inflation reports. Recall that on Wednesday the market began fresh active dollar buying after the slightly hotter-than-expected September inflation print. Yet within a few hours the dollar was sold off, surprising many analysts. In our view, nothing about this is mysterious. The US dollar has risen almost every day for almost a month, and the market has already priced in virtually every possible bullish factor for the greenback. Euro-positive fundamentals and macro data remain ignored, so Wednesday's move was a routine retracement driven by profit-taking on some short positions. As for Thursday, the 5-minute chart clearly shows price moved sideways throughout the European and US sessions. Accordingly, there was no meaningful reaction to Eurozone industrial-production data or to US PPI and retail-sales releases.
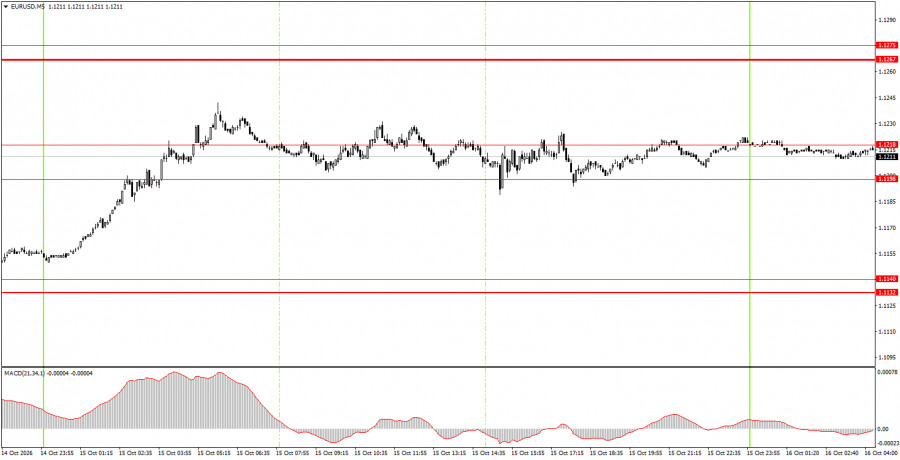
On the 5-minute timeframe, Thursday produced no trading signals; price traded sideways almost all day inside the 1.1198–1.1218 area. Volatility was minimal and macro events were largely ignored.
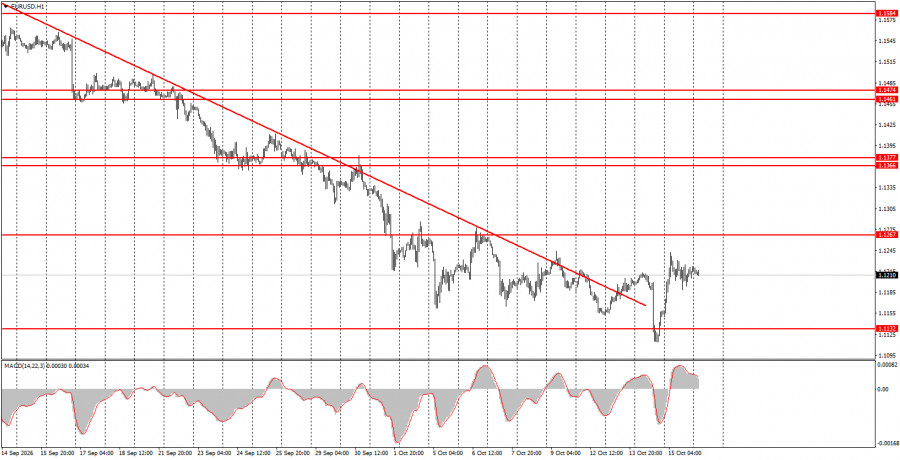
On the hourly timeframe, EUR/USD retains a downward tendency that qualifies as a full trend despite the recent trendline breach. Given recent events, we do not believe the euro should be collapsing like a stone. Yet the market keeps buying the US dollar regardless of events, releases, or their content.
On Friday, novice traders may consider new short positions if price closes below the 1.1198–1.1218 area, targeting 1.1132–1.1140. Open long positions on a close above the 1.1198–1.1218 area, targeting 1.1267–1.1275.
On the 5-minute timeframe consider the levels 1.1011, 1.1088, 1.1132–1.1140, 1.1198–1.1218, 1.1267–1.1275, 1.1366–1.1377, 1.1461–1.1474, 1.1527–1.1531, 1.1584–1.1594, 1.1655–1.1665. On Friday, the Eurozone will publish the second estimate of September inflation, the US Federal Reserve chair, Kevin Warsh, will speak (in the morning), and industrial-production data will be released. The Fed chair's remarks can trigger market volatility.
Price levels (areas) of support and resistance serve as targets for opening buy or sell trades or as sources of signals.
Red lines indicate channels or trend lines that show the current trend and the preferred trading direction.
The MACD indicator (14,22,3) — the histogram and signal line — is an auxiliary indicator that can also provide signals.
Important speeches and reports (listed in the news calendar) can significantly influence currency pair movements. Therefore, during their release, traders should approach trading with utmost caution, or exit the market to avoid sudden reversals against the preceding move.
Beginner forex traders should remember that not every trade can be profitable. Developing a clear strategy and practicing money management are key to long-term success in trading.

QUICK LINKS



















 Contact Us