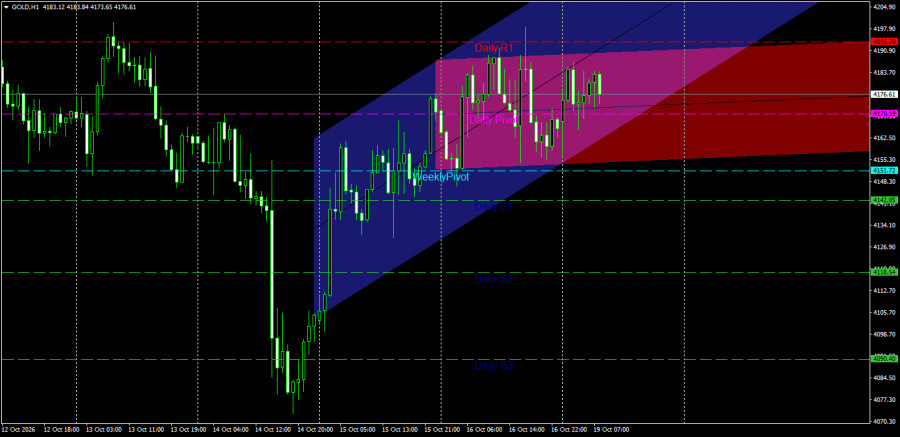
The one-hour (H1) chart for Gold (GOLD) shows a price movement leaning toward an upside recovery. The price is currently trading at 4176.61, maintaining gains following a strong rebound from a recent pivotal low and remaining within ascending price channels.
Technical Analysis and Price Action
Ascending Channel Structure: The price is clearly trading within a primary ascending channel (in blue), reflecting a shift in the intraday trend toward the upside following a sharp recovery from a low. Intersecting with this is a secondary ascending channel (in pink/red), which defines the current range of positive fluctuation. Notably, the price is moving near the middle of the primary ascending channel while consistently testing the upper boundaries of the buying zone.
Interaction with Pivot Levels: Gold successfully broke above the weekly pivot point at 4151.72, subsequently rising to surpass the daily pivot point at 4170.19. Remaining above both the daily and weekly pivots reinforces buying momentum. Meanwhile, the first daily resistance level (Daily R1) at 4193.70 serves as the primary barrier the price must overcome to continue its upward trend.
Key Support and Resistance Levels
Major Resistance Levels:
First Resistance: 4193.70 (Daily R1 and a recent intraday high).
Second Resistance: 4204.90 (A higher technical resistance level). Pivot Resistance: 4220.00 and above (should bullish momentum persist).
Key Support Levels:
First Support: 4170.19 (Daily Pivot).
Second Support: 4151.72 (Weekly Pivot).
Main Support: 4142.05 (Daily S1).
Price Action Outlook and Trading Recommendations
Bullish Scenario (Primary):
A positive trajectory is the most likely outcome in the intraday timeframe, provided the price remains above the daily pivot (4170.19) and, more importantly, above the weekly pivot (4151.72).
Recommendation: Buy upon a positive rebound from nearby support levels at 4170.19, or upon a retest of the weekly pivot.
Technical Targets: The first target is the daily resistance level at 4193.70; a sustained breakout above this level would open the way toward 4204.90.
Stop Loss: A one-hour candle close below 4150.00.
Bearish Corrective Scenario (Alternative):
This scenario is triggered if the price breaks below the daily and weekly pivot level of 4151.72 and settles below it with a strong one-hour candle.
Confirmation Criteria: A break below 4151.72 and an exit from the pink-colored ascending channel. Technical objectives: Paving the way for a downward correction targeting the first daily support level at 4142.05, followed by the second daily support level at 4118.54.
The four-hour (H4) chart for Gold (GOLD) shows price action currently trading at the 4176.27 level. The price maintains a positive stance following repeated attempts to retest pivot levels, establishing higher lows above the weekly pivot point.
Technical Analysis and Price Action
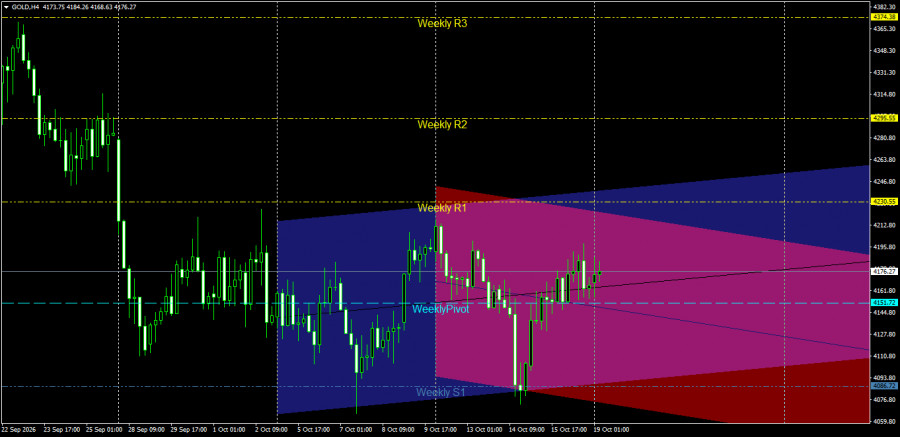
Price Channel Structure: The price is trading within a broad ascending channel (in blue), reflecting recent recovery efforts. Intersecting this is a smaller, corrective descending channel (in pink/red), which is pushing the price toward sideways, range-bound movement. Notably, the price recently rebounded from an intraday pivot low near the first weekly support level (Weekly S1) at 4086.72, and is now heading toward the midline of the primary channel.
Interaction with Pivot Levels: Gold has successfully maintained its position above the weekly pivot point (Weekly Pivot) at 4151.72, which now serves as a solid, pivotal support line preventing further declines for the time being. Conversely, the price faces pressure from the first weekly resistance level (Weekly R1) at 4230.55—a key target for buyers to confirm the strength of the uptrend.
Key Support and Resistance Levels
Major Resistance Levels:
First Resistance: The 4195.80 – 4212.80 range (representing recent intraday peaks). Second Resistance: 4230.55 (Weekly R1).
Pivot Resistance: 4295.55 (Weekly R2).
Key Support Levels:
First Support: 4151.72 (Weekly Pivot).
Second Support: 4127.80 (Advanced Intraday Support).
Main Support: 4086.72 (Weekly S1).
Price Action Outlook and Scenarios
Bullish Scenario (Primary):
A positive trajectory is the most likely outcome for the intraday timeframe, provided the price remains above the weekly pivot level of 4151.72.
Recommendation: Buy while the price holds above 4151.72, or upon the appearance of a bullish reversal candle following a retest.
Technical Targets: Aim for the 4195.80 area as a first target, with potential extension toward the first weekly resistance level at 4230.55.
Stop Loss: A 4-hour candle close below 4140.00.
Bearish Corrective Scenario (Alternative):
This scenario is triggered if the price breaks below the weekly pivot level of 4151.72 and sustains that position with a strong 4-hour candle.
Confirmation Condition: A break below 4151.72 followed by stabilization beneath it. Technical Objectives: A return to targeting intraday support levels at 4127.80, with a potential extension of the decline toward the first weekly support level at 4086.72.
Risk Management
Trading during sideways movements between pivot lines requires strict adherence to capital management rules. Risk per trade should be limited to a maximum of 1% to 2% to protect the account against sudden volatility.

QUICK LINKS









 Contact Us