Stock market analytics, financial forecasts

Forexmart's Market Analysis section provides up-to-date information about the financial market. The overviews are intended to give you an insight into current trends, financial forecasts, global economic reports, and political news that influence the market.

Disclaimer:  Information provided here to retail and professional clients does not contain and should not be construed as containing investment advice or an investment recommendation or an offer or solicitation to engage in any transaction or strategy in financial instruments. Past performance is not a guarantee or prediction of future performance.

#NDX – Technical Analysis Overview
23:45 2025-03-26 UTC--4
Exchange Rates analysis

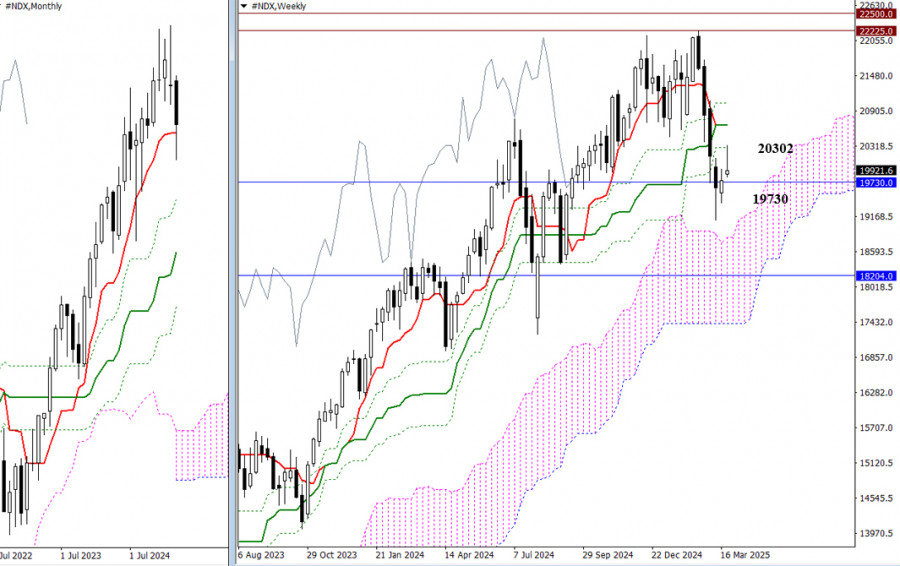
A stall at the monthly short-term trend level (19730) prompted an effort by bulls to reclaim their positions. As a result, a bullish gap formed at the start of the new trading week, with a test of the weekly resistance level at 20302. If this level is breached, the market will face two additional weekly resistance zones slightly above (20669 – 21036). However, if bulls lose momentum during a retest, the opposing side could swiftly return the market to the gravitational zone around the monthly Tenkan (19730), aiming to break the recent low (19113) and intensify bearish sentiment.

analytics67e4c6648a037.jpg

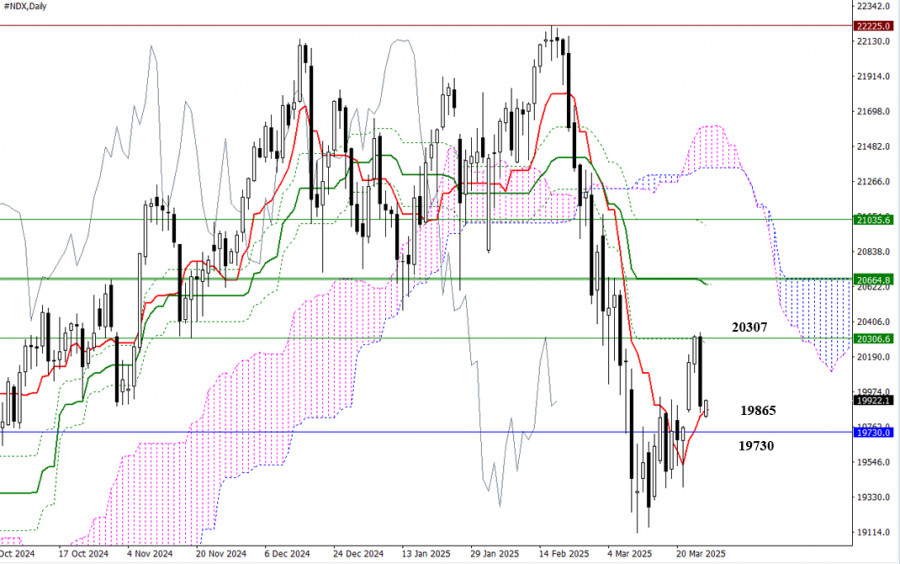
Yesterday's test of the Kijun Fibonacci levels (daily and weekly at 20302) resulted in a daily rebound. By the end of the session, the market had corrected downward to the daily short-term trend level (19865). The daily short-term trend supports (19865) and monthly supports (19730) will try to defend bullish interests. Failure to hold, breaking these supports, and moving out of the current attraction zone will shift market attention toward bearish targets—specifically, a new low at 19113 and a possible resumption of the broader downtrend.

analytics67e4c67620ab4.jpg

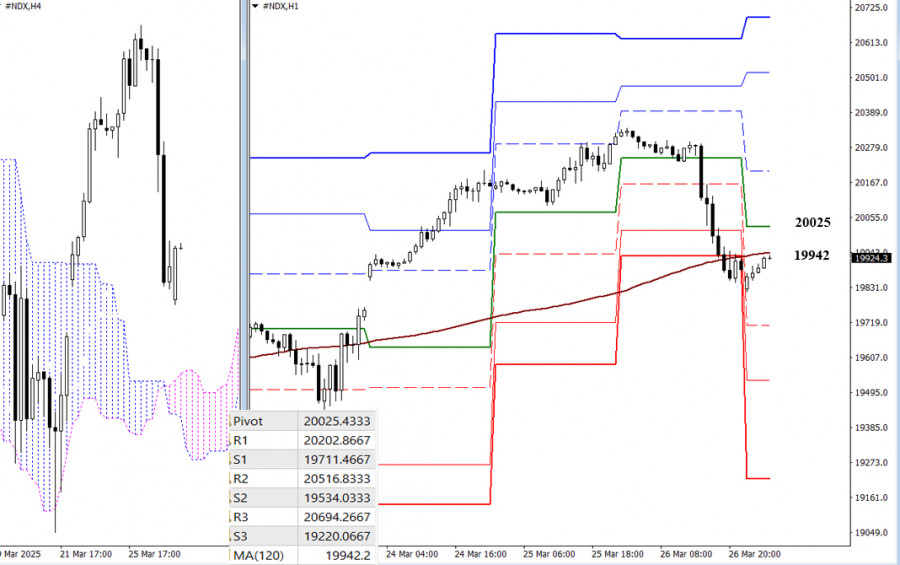
In the lower timeframes, the market now interacts with a key level determining the primary advantage: the weekly long-term trend in 19942. Whichever side holds this level will likely gain further momentum. Additional intraday bearish targets include the support levels of the classic Pivot Points (19712 – 19534 – 19220). Resistance levels at the classic Pivot Points (20025 – 20203 – 20517 – 20694) may serve as useful guides for bulls aiming to recover.

***

Technical Analysis Components:

  • Higher Timeframes: Ichimoku Kinko Hyo (9.26.52) and Fibonacci Kijun levels
  • H1: Classic Pivot Points and 120-period Moving Average (weekly long-term trend)
Feedback

ForexMart is authorized and regulated in various jurisdictions.

(Reg No.23071, IBC 2015) with a registered office at Shamrock Lodge, Murray Road, Kingstown, Saint Vincent and the Grenadines

Restricted Regions: the United States of America, North Korea, Sudan, Syria and some other regions.


© 2015-2025 Tradomart SV Ltd.
Top Top
Risk Warning:
Foreign exchange trading carries a high risk of losing money due to leverage and may not be suitable for all investors. Before deciding to invest your money, you should carefully consider all the features associated with Forex, as well as your investment objectives, level of experience, and risk tolerance.