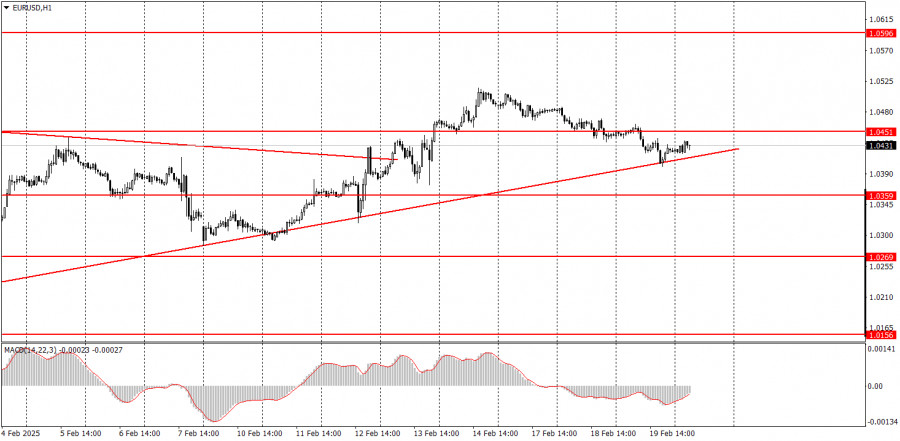
On Wednesday, the EUR/USD currency pair continued to experience minimal volatility and a downward trend. Throughout the day, several macroeconomic reports were released, but none had a significant impact. The economic calendar for the Eurozone was completely empty, while the United States issued two reports labeled as "important," but they did not prove to be influential. There was no market reaction to the data on building permits and housing starts. As expected, the FOMC meeting minutes did not bring any new insights to the forex market. These minutes are typically seen as formalities; two weeks have passed since the meeting, rendering the information somewhat outdated, and all essential details are usually provided immediately after the meeting. As a result, Wednesday was the third consecutive "boring Monday." The price remains above the trendline, but it could potentially break below it either today or tomorrow.
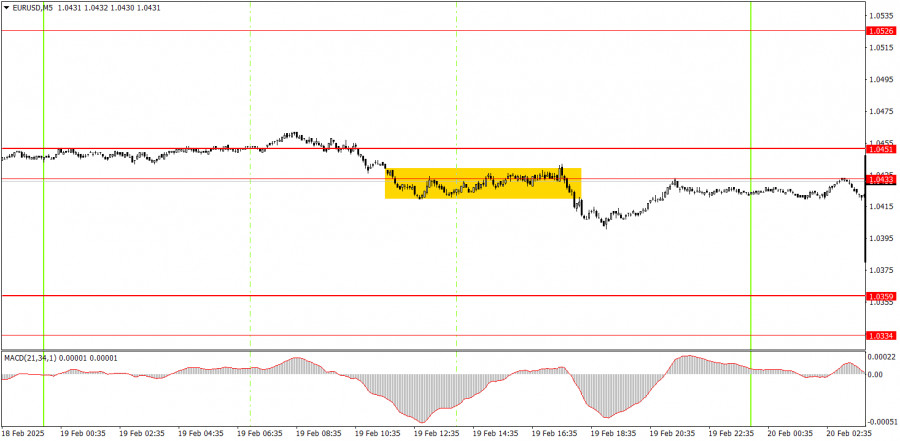
Only one trading signal was formed in the 5-minute timeframe near the 1.0433-1.0451 area. Due to the extremely low volatility, novice traders are unlikely to capitalize on this signal. No other signals were generated throughout the day, and price movement remained sideways.
On the hourly timeframe, the EUR/USD pair is currently experiencing a medium-term downward trend and a local upward trend. A further decline in the euro is anticipated, as both fundamental and macroeconomic factors are currently more supportive of the U.S. dollar than the euro. However, the upward correction on the daily timeframe may continue for several more weeks. It is likely that we will see multiple trends on the hourly chart before the main decline resumes.
On Thursday, market movements may be erratic, illogical, or simply weak. Although the market has an inclination toward growth due to the need for correction on the daily timeframe, pullbacks and declines are also expected.
For the 5-minute timeframe, consider the following levels: 1.0156, 1.0221, 1.0269-1.0277, 1.0334-1.0359, 1.0433-1.0451, 1.0526, 1.0596, 1.0678, 1.0726-1.0733, 1.0797-1.0804, 1.0845-1.0851. It is important to note that on Thursday, there are no scheduled key events or reports in either the Eurozone or the U.S., which means there will be no fundamental catalysts to drive volatility. As a result, volatility may remain quite low, making it unwise to open new positions based on any trading signals.
Support and Resistance Levels: These are target levels for opening or closing positions and can also serve as points for placing Take Profit orders.
Red Lines: Channels or trendlines indicating the current trend and the preferred direction for trading.
MACD Indicator (14,22,3): A histogram and signal line used as a supplementary source of trading signals.
Important Events and Reports: Found in the economic calendar, these can heavily influence price movements. Exercise caution or exit the market during their release to avoid sharp reversals.
Forex trading beginners should remember that not every trade will be profitable. Developing a clear strategy and practicing proper money management are essential for long-term trading success.

QUICK LINKS


 Contact Us

