Stock market analytics, financial forecasts

Forexmart's Market Analysis section provides up-to-date information about the financial market. The overviews are intended to give you an insight into current trends, financial forecasts, global economic reports, and political news that influence the market.

Disclaimer:  Information provided here to retail and professional clients does not contain and should not be construed as containing investment advice or an investment recommendation or an offer or solicitation to engage in any transaction or strategy in financial instruments. Past performance is not a guarantee or prediction of future performance.

BCH/USD – Weekly Results and Outlook
23:29 2025-02-16 UTC--5
Exchange Rates analysis

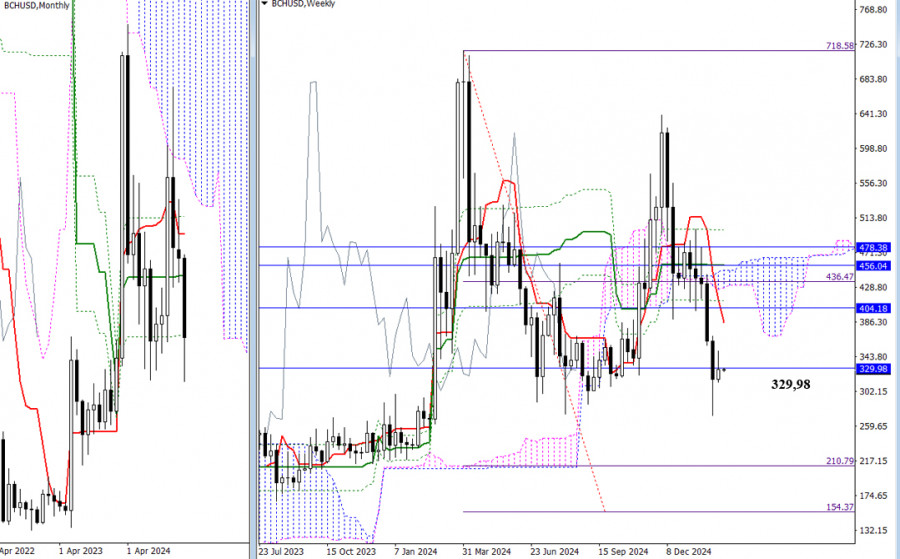
The final support level of the monthly Ichimoku cross at 329.98 has been reached. The market took a pause last week, remaining influenced by this level. If bears succeed in breaking the monthly golden cross, they will next target the Ichimoku cloud (210.79 - 154.37) on a weekly basis, which could open new opportunities. However, if the support at 329.98 holds, the bulls may attempt to regain control, initially targeting resistance levels at 386.15 and 404.18, which correspond to the weekly short-term trend and the monthly medium-term trend.

analytics67b2ba76f1695.jpg

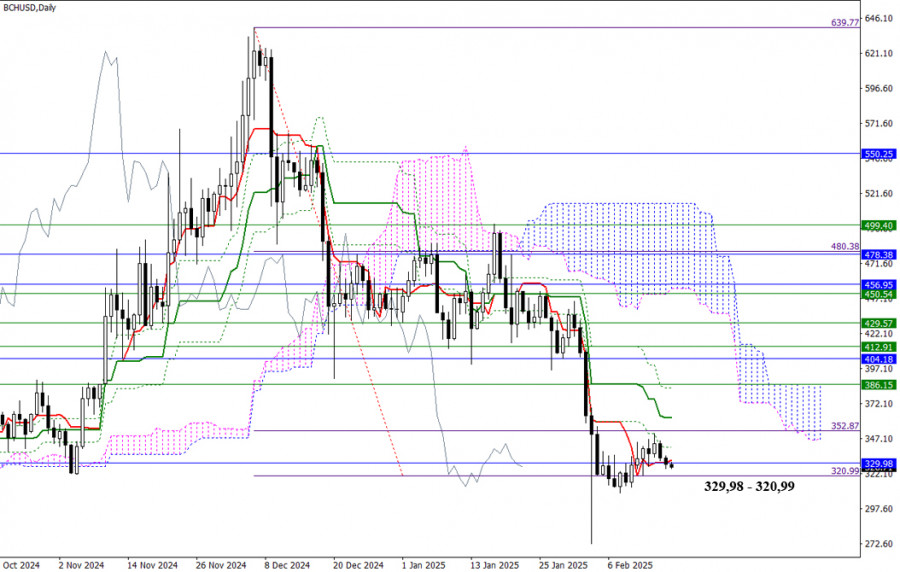
On the daily timeframe, the downside breakout target of the Ichimoku cloud at 320.99 has been met. This target was reinforced by the monthly support level of 329.98, creating a strong area for price stabilization. It is possible that these support levels will be sufficient to halt the current decline. If this occurs, the primary goal for the bulls will be to initiate a corrective rebound and test the resistance levels of the daily Ichimoku cross at 340.92, 362.12, and 383.47. The daily cross is further supported by the weekly short-term trend at 386.15, indicating that breaking the bearish daily cross will also require overcoming the weekly short-term resistance. For the bears, the immediate target remains to break below the previous low of 272.32 and resume the downtrend.

analytics67b2ba873a405.jpg

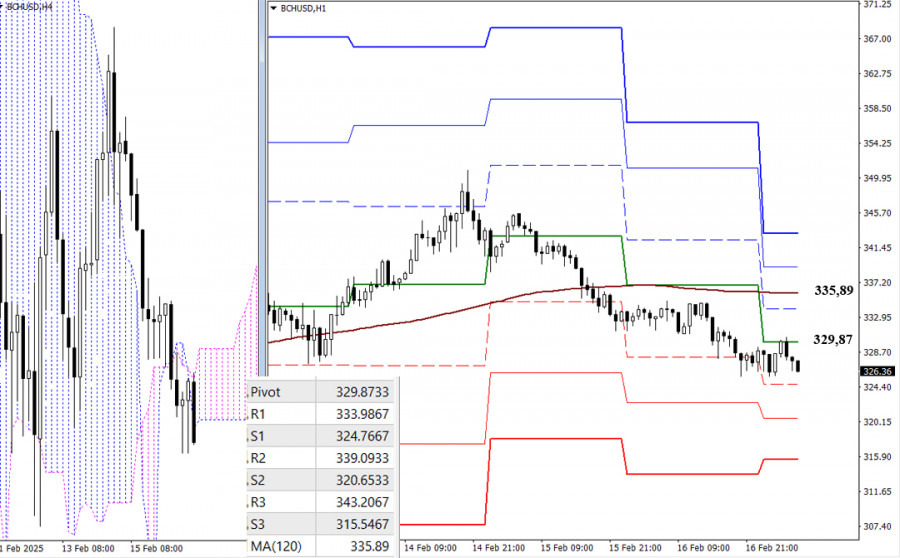
On lower timeframes, the bears currently hold the advantage. The downside targets for intraday continuation are the classic Pivot Point support levels at 324.77, 320.65, and 315.55. The key levels on the lower timeframes today are 329.87 (the daily central Pivot Point) and 335.89 (the weekly long-term trend). A breakthrough of these levels and a trend reversal could change the balance of power. Additional intraday resistance levels include the classic Pivot Point resistances at 339.09 and 343.21.

***

Technical Analysis Components:

  • Higher Timeframes: Ichimoku Kinko Hyo (9.26.52) and Fibonacci Kijun levels
  • H1: Classic Pivot Points and 120-period Moving Average (weekly long-term trend)
Feedback

ForexMart is authorized and regulated in various jurisdictions.

(Reg No.23071, IBC 2015) with a registered office at Shamrock Lodge, Murray Road, Kingstown, Saint Vincent and the Grenadines

Restricted Regions: the United States of America, North Korea, Sudan, Syria and some other regions.


© 2015-2025 Tradomart SV Ltd.
Top Top
Risk Warning:
Foreign exchange trading carries a high risk of losing money due to leverage and may not be suitable for all investors. Before deciding to invest your money, you should carefully consider all the features associated with Forex, as well as your investment objectives, level of experience, and risk tolerance.